Geography and Environment
- S1: Geography TG File Uploaded 16/08/22, 09:52
- S1: Geography SB File Uploaded 16/08/22, 09:56
UNIT 8:Weather and climate

By the end of this unit, you must be able to recognise the importance of the atmosphere, differentiate weather from climate and classify major climatic types.
Unit objectives
By the end of this unit, you must be able to:
(a) state the difference between weather and climate
(b) identify layers of the atmosphere and state its importance
(c) outline the elements of weather and climate
(d) identify weather instruments at a weather station
(e) state the factors influencing temperature variation
(f) identify how to measure temperature
(g) state the major processes of the water cycle
identify different types of precipitation
(i) state different types/forms of rainfall
(j) explain the factors influencing atmospheric pressure variation
(k) identify the factors influencing humidity and how to measure humidity
(l) identify different types of winds
(m) state different types of clouds
define sunshine
(o) outline factors influencing climate
(p) outline the relationship between climate and human activities.
Definition of atmosphere, weather and climate

Work in pairs.
1. Use the Internet and geography textbooks to find out the composition of the atmosphere.
2. Record your findings and discuss them in a class presentation
In Unit 3, you learnt that the atmosphere is one of the elements of the earth. You defined the atmosphere as the thin layer of gases that surrounds the earth. It is a mixture of gases like nitrogen, oxygen, water vapour, carbon (IV) oxide and others. It is held onto the earth by the force of gravity.
In simple terms, the term atmosphere refers to the envelope of air surrounding the earth.
Work in groups of three.
1. Go outside the classroom and observe the nature of the day.
2. Study the wind, sunshine, temperature and clouds.
3. Write down the observations in your notebooks.
4. Compare your observations with those of other members of the class in a discussion.
Weather refers to the day to day conditions of the atmosphere. It is described in terms of temperature, wind, rain, moisture, atmospheric pressure, humidity, sunshine and clouds.
The weather of the day can be described as: windy, rainy, sunny or cloudy. This depends on the elements of weather. The element that dominates the day describes the weather.
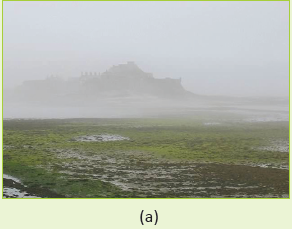
Use the following photographs to describe the weather conditions shown. Do this individually.
Climate refers to the weather conditions prevailing in an area over a long period of time.

Your teacher will take you to a field visit to a weather station.
1. Observe the weather records kept in the station for the last one year.2. Describe the weather conditions observed.
3. Describe the climate of the area.
4. Identify the dominant activity carried out by the people who live in the area.
5. Find out how the climate of the area influences the activity.
6. Discuss and record you findings.
7. Present your findings in a class discussion.
Atmosphere
You learnt about the atmosphere earlier in this unit. You defined the atmosphere and the gases that make the atmosphere.
The structure of the atmosphere
The atmosphere is divided into four major distinct zones or layers. These distinctions are based on changes in temperature with increase in altitude. The zones are separated by transitional boundaries.
(a) Troposphere (c) Mesosphere
(b) Stratosphere (d) Thermosphere
Troposphere
• This is the lowest layer of the atmosphere.
• It is also the site of all weather on earth. It is thus the most important layer to meteorologists.
• It contains about 75% of the atmosphere’s mass and 99% of its water vapour.
• It has an average depth of about 17 kilometres in the mid latitudes. It is deeper in the tropics about 20 kilometres and shallower towards the poles about 7 kilometres.
• This is the zone where temperatures reduce with increase in altitude. The higher one goes the cooler it becomes.
Towards the end of this zone temperature reduce to almost – 67°F (–20°C).
• Atmospheric pressure also falls with increase in height.
• The speed of wind increases with increase in height.
• It is the only life supporting layer.
• The transitional zone between the troposphere and the stratosphere is known as the tropopause.
Stratosphere
• This is the second layer of the atmosphere.
• The bottom of the stratosphere is around 10 kilometres above the about at middle latitudes. The top of the stratosphere occurs at an altitude of 50 kilometres. The height of the bottom of the stratosphere varies with latitude and with the seasons. The lower boundary of the stratosphere can be as high as 20 kilometres near the equator. It can also be as low as 7 kilometres at the poles in winter.
• In this zone, temperature increase with increase in altitude, and this is called temperature inversion.
• It is in this zone where the ozone layer is found. The ozone layer is the oxygen isotope whose concentration is 25 – 30 kilometres above the sea level.
The ozone layer
The ozone layer is important due to the following reasons.
(a) The sun’s insolation has dangerous rays called ultra-violet rays. These rays are dangerous to humans. The ozone layer filters the sun’s insolation by removing these rays.
(b) The ozone layer regulates temperatures in the lower atmosphere. This prevents the melting of ice and effects of global warming.
Ozone layer depletion
Ozone layer depletion refers to the damaging of the ozone layer by air pollutants.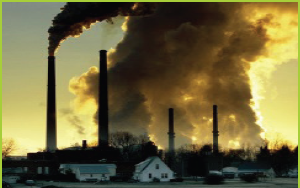
Fig 8.2 Smoke from industries containing gases that destroy the ozone layer.
This happens due to the impact of some gases like chlorofluorocarbons (CFCs) and methane gas. These gases eat up some parts of the ozone layer creating holes in it. The holes are called atmospheric windows.
The destruction of the ozone layer has led to serious effects which include the following.
(a) Increase in temperatures resulting in many of the glaciers melting.
(b) Rise in the sea level due to the incoming melt water .
(c) Diseases like skin cancer.
(d) Extinction of some plant and animal species due to the harsh climatic conditions.
(e) Prolonged droughts and global warming in general that results to environmental degradation.
The lower boundary of the stratosphere is called the tropopause. The upper boundary is called the stratopause.

Work in pairs.
Study the photograph below and answer the questions that follow.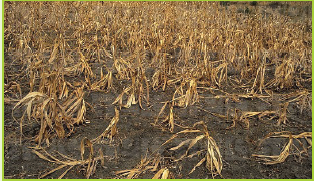
Fig 8.3
1. What could have caused these crops to look like this?
2. Analyse the effects of drought on the environment.
3. Suggest ways in which drought can be prevented.
4. Record your findings.
5. Present your findings in a class presentation.
Mesosphere
• This is a part of the atmosphere that is above the stratosphere.
• It is separated from the stratosphere by a line of transition called the tropopause.
• It is the third layer in the zonation within the atmosphere.
• Its extends from about 50 – 85 kilometres above the earth.
• This the coldest layer in the atmosphere. Temperatures fall to between – 90°C to -101°C at the mesopause. This is the upper limit of the mesosphere.
• The area has the strongest winds nearly 3000km/hour which hardly allow temperatures to increase.
• The transitional zone between the mesosphere and the thermosphere is known as the mesopause.Thermosphere
• This layer starts from the mesopause – a line of transition that separates the thermosphere from mesosphere. It then continuously reaches up to the upper limit of the atmosphere.
• It extends from about 90 kilometres to between 500 and 1,000 kilometres above our planet.
• Here temperatures increase with altitude because of the absorption of solar energy.
• Temperatures in this zone rise tonearly 15000C and above.
• Gases in the thermosphere separate into different layers as follows;
(a) Oxygen zone – lower layer
(b) Helium zone – middle zone
(c) Atomic hydrogen – uppermostlayer
This mesosphere and thermosphere form one layer called ionosphere.
This region is named so for its relatively large concentrations of ions.
The transitional zone between the thermosphere and the exosphere is known as the thermopause.
Exosphere
This is the uppermost region of earth’s atmosphere as it gradually fades into the vacuum of space.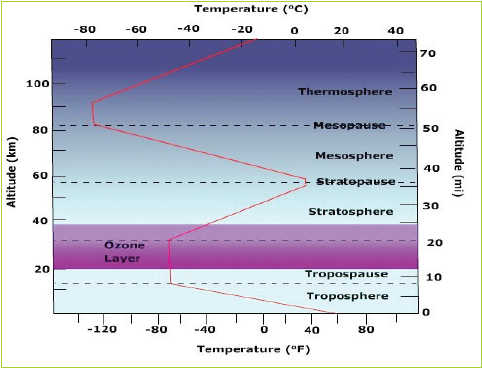
Fig 8.4 Layers of the atmosphere.
Air in the exosphere is extremely thin.In many ways it is almost the same as the airless void of outer space.
It extends to a distance of about 1000 kilometres above the earth’s surface. It extends into interplanetary space.
• It is distinctively dark.
• It is a zone of low density. Atoms fly into space because they are freed from the earth’s gravity.
• The atmosphere shields the earth from ultra-violet rays which are harmful to all life forms on earth.
• The atmosphere facilitates wireless communication. This is due to the ionosphere where there are electromagnetic waves. These waves are reflected back to the earth’s surface.
• The atmosphere regulates the temperatures experienced along the earth’s surface where life exists (flora and fauna).
• The atmosphere and its associated winds are utilised to increase generation of electricity-wind energy.

Work in pairs.
Using the Internet and other geographical documents.
1. Describe each layer of the atmosphere and its characteristics.
2. Record your findings.
3. Discuss your findings in a class discussion.
Composition of the atmosphere
The atmosphere consists of gases such as nitrogen, oxygen, water, carbon (IV) oxide, water vapour and ozone. Nitrogen and oxygen gases occur in larger volumes than other gases.The importance of atmosphere
The atmosphere facilitates the formation of rainfall hence raising the operation of the water cycle.
The atmosphere provides air which is necessary for plant, animal and human life.
The atmosphere provides case studies for research, especially the meteorologists.
The atmosphere shields the earth from ultra-violet rays which are harmful to all life forms on earth.
The atmosphere facilitates wireless communication. This is due to the ionosphere where there are electromagnetic waves. These waves are reflected back to the earth’s surface.
The atmosphere regulates the temperatures experienced along the earth’s surface where life exists (flora and fauna).
The atmosphere and its associated winds are utilised to increase generation of electricity-wind energy.

Work in pairs.
Using the Internet and other geographical documents.
1. Describe each layer of the atmosphere and its characteristics.
2. Record your findings.
3. Discuss your findings in a class discussion.
Composition of the atmosphere
The atmosphere consists of gases such as nitrogen, oxygen, water, carbon (IV) oxide, water vapour and ozone. Nitrogen and oxygen gases occur in larger volumes than other gases.The importance of atmosphere
• The atmosphere facilitates the formation of rainfall hence raising the operation of the water cycle.
• The atmosphere provides air which is necessary for plant, animal and human life.
• The atmosphere provides case studies for research, especially the meteorologists.
• The atmosphere shields the earth from ultra-violet rays which are harmful to all life forms on earth.
• The atmosphere facilitates wireless communication. This is due to the ionosphere where there are electromagnetic waves. These waves are reflected back to the earth’s surface.
• The atmosphere regulates the temperatures experienced along the earth’s surface where life exists (flora and fauna).
• The atmosphere and its associated winds are utilised to increase generation of electricity-wind energy.

Work in groups of three.
Use the Internet and Geography textbooks.
1. Find out other importance of the atmosphere.
2. Discuss how Rwanda benefits from the atmosphere.
3. Record your findings.
4. Present your findings in a class discussion.
Elements of weather and climate

Work in pairs.
1. Describe the weather condition this morning on your way to school.
2. Look outside your classroom and describe the weather outside.
3. Write down your findings and present them in a class discussion.

Work in groups of three.
Use the environment in your school or home, the Internet and geography textbooks.
1. Describe other elements of weather and climate.
2. Record your findings.
3. Present them in a class discussion.
The weather conditions experienced at different times of the day are referred to as elements of weather. These are aspects that describe the atmospheric conditions. Humans depend on these elements to interpret the weather and climate of a given place.The following are the elements of weather and climate
- . Sunshine
- Temperature
- Atmospheric pressure
- Wind
- Humidity
- Cloud cover
- Precipitation
- Visibility
- The weather and climatic conditions of any given place can be influenced by one or more of these elements. The elements can be observed, measured and recorded daily in a weather station.
(a) Sunshine
This is the light or amount of solar radiation received on the surface of the earth from the sun. The amount of sunshine received in a place depends on cloud cover, aspect and latitude. Thick cloud cover reduces the amount of sunshine and its duration. Sunshine is more intense when the sky is clear. The amount of sunshine of a place is recorded as a mean of sunshine hours per day.
(b) Temperature
This describes the hotness or coldness of a place. High temperatures are experienced on sunny cloudless days. Low temperatures are experienced on cloudy days and at night. Thus the temperature of a place is a result of the amount of heat energy received from the sun.
(c) Atmospheric pressure
This is the weight exerted by a vertical column of air onto the earth’s surface. This weight is exerted by the force of gravity. Atmospheric pressure is greater on the ground surface and greatest at sea level. It decreases with increase in altitude.
(d) WindThis is moving air caused by pressure difference. It moves from a zone of high pressure to a zone of low pressure. It moves in a horizontal manner.
(e) Humidity
This is the amount of water vapour in the atmosphere. Water vapour is obtained from water bodies and the ground surface. It is obtained through evaporation and from plants through transpiration. The amount of water in the air depends on:
• Temperature
• Size of water bodies present in a place
• Prevailing winds.
Thus, places with large water bodies and high temperatures have higher amounts of water vapour than those without. Onshore and calm wind facilitate build-up of water vapour on land. Offshore and very strong winds blow away the water vapour from the land.
(f) Cloud cover
Clouds are tiny droplets of water or ice suspended in the air. They are formed when water vapour condenses into water droplets or ice crystals. These crystals condense around things such as dust, salt or smoke particles moving in the atmosphere.
(g) Precipitation
This is the deposition of moisture in liquid or solid form falling from onto the earth from the clouds. It is in the form of rain, hail, frost, sleet, snow or frost.
Visibility
This is the measure of distance at which an object or terrain can be clearly seen. Visibility is reported in metres. It is reported as a prevailing value of the visibility at all directions.

1. Observe the weather around your school and home for about a week.
2. Describe the weather changes through the week.
3. Find out the reason why the weather keeps changing.
4. Record your findings and discuss them in your group.
5. Make a class presentation on your findings.
Task 8.1 1.
(a) Define the term weather.
(b) Differentiate between weather and climate.
2. State the elements of weather.
3. (a) Define the term atmosphere.
(b) With the help of a diagram, describe the major layers or zones that form the atmosphere.
4. (a) Define the term ozone layer.
(b) Explain the importance of the ozone layer to humans and wildlife at large.
5. (a) Explain the meaning of depletion of the depletion of the ozone layer depletion.
(b) Analyse the causes of the ozone layer.
6. (a) What are atmospheric windows?
(b) State and explain the effects of atmospheric windows on the environment.
7. Discuss the importance of atmosphere to humans and to the environment.
The weather station and its instruments

Work in groups of three.
1. Show how the following elements of weather are measured using local resources.
(a) Temperature (c) Wind speed
(b) Rainfall (d) Sunshine
2. Write down your finding and discuss them in class
A weather station is a place where observation, measurement and recording of elements of weather is done. These activities are carried out on a daily basis. The information obtained is used to describe the weather of a place.
At a weather station, different instruments are found. Each instrument is used for collecting specific data on given elements of weather.
Table 8.2 shows elements of weather and the instruments used to measure them.
Table 8.2 Weather instruments.
Element Instrument Lines drawn on a map showing each element Temperature Thermometer Isotherms Rainfall Rain gauge Isohyet Wind speed Anemometer Isotachs Wind direction Wind vane Isogons Atmospheric pressure Barometer/aneroid barometer Isobars Humidity Hygrometer Isohumes Sunshine Sunshine recorder Isohels Cloud cover Ceilometer/ceiling light (height of cloud), cloud cover radiometer (CCR) Isonephs
Thermometer
A thermometer measures the air temperature. Most thermometers are closed glass tubes containing liquids such as alcohol or mercury. When air around the tube heats the liquid, it expands and moves up the tube. A scale then shows what the actual temperature is.
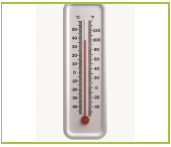
Fig 8.5 Weather thermometer.
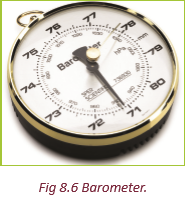
Barometer
A barometer measures air pressure. It tells one whether or not the pressure is rising or falling. A rising barometer means sunny and dry conditions. A falling barometer means stormy and wet conditions.
Rain gauge
A rain gauge measures the amount of rain that has fallen over a specific time period.
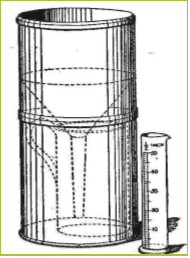
Fig 8.7 A rain gauge.Wind vane
A wind vane is an instrument that determines the direction from which the wind is blowing.

Fig 8.8 Wind vane.
Windsock
It also shows the direction and relative speed of wind. It determines the direction that the wind is blowing towards. It consists of a bag like cloth closed at one end and open on the other
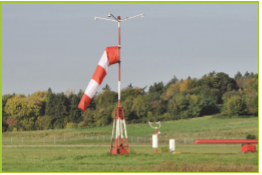
Fig 8.9 A windsock.
Anemometer
An anemometer measures wind speed. The cups catch the wind, turning a dial attached to the instrument. The dial shows the wind speed.
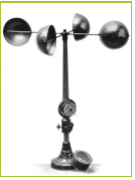
Fig 8.10 An anemometer.
Hygrometer
A hygrometer measures the water vapour content of air or the humidity.
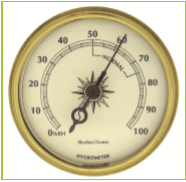
Fig 8.11 A hygrometer.
Sunshine recorder
- A sunshine recorder is a device that records the amount of sunshine at a location. The results provide information about the weather and climate of a geographical area.
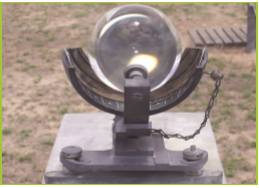
Fig 8.12 A sunshine recorder.
Ceilometer
This is a device that is used for measuring and recording the height of clouds.

Fig 8.13 A ceilometer.
A Stevenson screen
This is a special box in which the main delicate weather instruments are kept. It houses thermometers and the hygrometer. This is to protect the instruments from dew and rainfall. Rain and dew interfere with and damage the thermometers.
The thermometers that are found inside a Stevenson screen include the following.
• Maximum thermometer
• Minimum thermometer
• Wet-bulb thermometer
• Six’s thermometer

Fig 8.14 A Stevenson screen.Important points to note about a Stevenson screen
(a) It is made of wood. This is preferred to prevent the external heat. Wood is a bad conductor of heat.
(b) All the sides of the Stevenson screen have louvres to allow proper aeration. This is to allow free circulation of air. It is also to safeguard the thermometer from direct sun’s rays.
(c) The Stevenson screen is painted white. This is purposely to reflect heat. This implies that the sun’s insolation is reflected back. This prevents it influencing the temperatures inside the box.
(d) Stevenson screen is placed on a grass-covered ground. This is done to prevent the radiated heat from influencing the temperatures inside the Steven screen.
(e) The Stevenson screen is placed on a stand, about 121 cm above the ground. This enables the air temperatures to be easily determined.
(f) It is located far away from obstacles such as buildings, trees or concrete fences. This is to avoid disturbing the free movement of air. It also allows air to enter the Stevenson screen through the four louvred sides.
(g) The Stevenson screen has a double boarded roof. This prevents direct rays from the sun from influencing the temperatures inside the box.

Fig 8.15 A weather station with weather instruments.
In Rwanda, there are several weather stations. An example is the Nyamirambo weather station in Nyarugenge District, Kigali Province.

Do this individually.
Study Figure 8.15.
1. Identify some of the instruments in the photograph.
2. Why do you think it is necessary for such stations to be built in various parts of the country?
3. Does your school have a weather station?
4. If it does, how important is it?

Work in groups of three. Your teacher will take you for a field visit to a weather station.
1. With the help of a resource person, go round the station and identify the instruments available.
2. Record them in your notebooks.
3. The resource person at the station will show you how to:
(a) measure temperature using a thermometer
(b) check for the wind direction using a wind vane
(c) measure air pressure using a barometer.
4. Ask him or her to show you how to use any other weather instrument available at the station.
5. Record the measurements of the different elements of weather at the station.
6. Write a report on the weather and climate of the area around the station.
7. Make a class presentation on your findings.
Importance of a school weather station
(a) A school weather station enables the school administration and learners to save time and money. These resources would otherwise be spent on the distant field studies on weather stations.
(b) It provides a platform for practical studies to the learners. Learners are able to use the instruments to measure various elements of weather.
(c) The school weather station can enable learners know the weather of their school environment.
(d) The school weather station acts as a laboratory for geography lessons. In practical lessons, learners are involved in collecting data on various elements of weather. This make them understand what is studied in classrooms.
(e) The practical studies facilitated by such stations enable learners to acquire various skills. The skills include measuring, recording and analytical skills.
(f) The school weather station provides evidence on what certain specialists or professionals do. This helps in creating an inner passion in the learners to pursue careers like meteorology and climatology.
Task 8.2
1. (a) Describe a Stevenson screen.
(b) Explain the main features of a Stevenson screen.
2. Analyse the importance of a school weather station.
3. (a) Explain the main features of a good Stevenson screen.
(b) With the help of a diagram, name and describe the conditions that should be considered while installing a Stevenson screen.
(c) State the importance of the following on a Steveson Screen.
(i) wood
(ii) louvred sides
(iii) double roof
(iv) height of 121 cm above the ground.
4. Name the instruments kept inside the Stevenson screen.
5. Study the table below and fill in the necessary missing information

Temperature

1. Go outside the classroom. Describe the temperature of the air.
2. Compare day temperatures to night temperatures.
Temperature is defined as the degree of hotness and coldness of a given place. Temperature is one of the elements of weather. It is measured by an instrument called a thermometer. There are essentially three types of thermometers.
(a) Maximum thermometer
(b) Minimum thermometer
(c) Six’s thermometer
The maximum thermometer
The maximum thermometer is used to determine the highest temperature reached in a day. This thermometer has a small constriction in the tube just above the bulb. When the temperature increases, the mercury in the bulb expands upwards beyond the constriction. When there is a fall in temperature, the fluid threads break. The end of the mercury column is positioned at the maximum temperature.
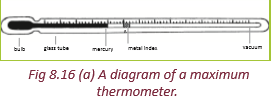

Fig 8.16 (b) A maximum thermometer
The minimum thermometer
This thermometer is responsible for showing the lowest temperature reached in a day. It does not use mercury but instead uses alcohol. When temperatures decreases, it causes the alcohol in the tube to contract. It then pulls along the index to the actual lowest point. To determine the lowest temperature, we use readings at end of the index near the surface of the alcohol.

Fig 8.17 (a) A diagram of a minimum thermometer.

Fig 8.17 (b) A minimum thermometer
The Six’s thermometer
This type of thermometer is used to measure maximum and minimum temperatures in a day. One of its sides has a maximum thermometer and the other minimum thermometer.

Fig 8.18 (a) Diagram of Six’s thermometer.

Fig 8.18 (b) Six’s thermometer
How it works
1. It has two scales namely the minimum and the maximum scale.
2. The maximum scale is progressive while the minimum scale is retrogressive .
3. When temperature increases, alcohol and mercury expand towards the maximum side.
4. Some of the alcohol in the maximum thermometer vapourises and occupies the empty space on top.
5. This flow pushes the index upwards up to the highest temperature.
6. When temperature reduces, there will be a reverse flow.
7. The maximum index will stay still at the maximum temperature. This time, the vapour that was in the vacuum turns back to liquid.
8. The mercury and liquid contract and the constriction forces the metal index in the minimum thermometer upwards.
9. As it continues upwards, it reads lower and lower temperature on the scale. It then stops on the lowest temperatures of the day.

1. Your teacher will give you samples of the maximum, minimum and Six’s thermometers.
2. Measure the maximum and minimum temperature inside your classroom and record your findings.
3. Measure the maximum and minimum temperature outside your classroom and record your findings.
4. Compare your findings with the rest of your class members.
Factors influencing variation of temperature
(a) Nature of the atmosphere
Solar radiation passes through the atmosphere. As it passes, it collects various gases and aerosols which are impurities. These impurities interfere with radiation by scattering, reflecting and absorbing part of the insolation. Eventually, the temperatures rise.
(b) The solar altitude
The noon sun is much more intense than the rising or setting sun. Therefore, at noon time, temperatures become higher than those experienced in morning and evening hours.
(c) The distance away from the sun
The longer the distance covered by solar radiation, the lower the temperature will be. The shorter the distance, the more the radiation and the higher the temperatures.
(d) Latitudinal location
This refers to the position of a place on the earth in relation to the equator. The areas near the equator have higher temperatures than areas far from the equator. The polar regions have lower temperatures.
(e) Altitudinal location
This is the location of an area measured from the sea level. Areas whose altitudes are high tend to have lower temperatures. Areas of low altitudes tend to have high temperatures.
(f) Nature of prevailing winds Winds
carry temperature and moisture from one place to another. Onshore winds cause lower temperatures on land. Winds which come from dry areas e.g. Hammatan winds cause high temperatures in the places they blow towards.
(g) The revolution of the earth round the sun
As the earth revolves around the sun, the solar altitude and the length of the day change. Hence, the intensity of the solar radiation (temperature) on the earth changes seasonally.
There is always a very powerful interaction between land and sea. This interaction involves movement of air and transfer of temperature. This happens through land and sea breezes.
(i) Ocean currents
Ocean currents are streams of water moving from specific areas, in particular regions with definite temperatures. Ocean currents are majorly of two types, warm and cold currents. Warm currents carry warm temperatures from the equator to areas they bathe. Cold currents originate from the polar regions and transfer cold temperatures.
(j) AspectAspect in this case refers to the degree to which an area is exposed to the sun. Some slopes are more exposed to the sun while others are shielded from the sun. Areas that are exposed to the sun will have higher temperature than those which are shielded.
(k) Cloud cover
The presence of clouds reduces both incoming and outgoing radiation. Thick clouds prevent solar radiation from striking the earth’s surface. This lowers temperatures of the land surface during the day.
(l) VegetationForested areas usually have cool temperatures. This is because the canopies of the trees act as an umbrella. They prevent solar radiation from striking the floor of the forest.
(m) Human activitiesHuman activities may influence temperature patterns which may cause global warming or cooling. Temperatures are higher in built-up areas like urban centres.
• Industries and motor vehicles also release a lot of carbon dioxide in the atmosphere. The carbon dioxide absorbs a lot of terrestrial radiation raising the air temperature.
• Burning large forests releases a lot of carbon dioxide. The carbon dioxide absorbs heat thus raising atmospheric temperatures.
• Clearing of forests also increases the amount of carbon dioxide in the atmosphere.

Work in pairs.
Work in pairs.
Use the Internet and other geographical documents.
1. Find out and explain other factors that cause variations in temperatures of different places.
2. Record your findings.
3. Present your findings in classroom
Calculations involved in determining the temperatures of a given area
Temperature is calculated in different ways. We can calculate:
• diurnal range temperatures
• mean daily temperature
• mean monthly temperature
• mean annual temperature
• mean annual range
(a) Diurnal range temperature
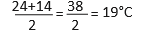
Diurnal range temperature = daily maximum temperature – daily minimum temperature.
For example: - If the maximum temperature of a day = 24°C and the minimum temperature of a day =14°C, then the diurnal range temperature will be: = 24–14=10°C
(b) Mean daily temperature
Mean daily temperature

Using the example in (a),
(c) Mean monthly temperature
The mean monthly temperature is the sum of mean daily temperatures divided by the number of days in a month. Suppose the total sum of the mean daily temperature of the month of June is 246.
The mean monthly temperature

(d) Mean annual temperature
The mean annual temperature equals the sum of mean monthly temperatures for a year divided by the number of months in a year.
Table 8.3 Mean monthly temperatures.
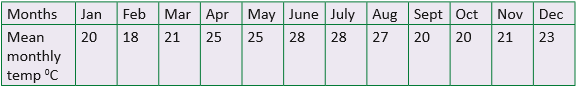
From Table 8.3, the mean annual temperature is
(e) Mean annual range
The mean annual range = the highest mean monthly temperature – the lowest mean monthly temperature. Using Table 8.3:
The highest mean monthly temperature = 28°C
The lowest mean monthly temperature = 20°C
Therefore the mean annual range = 28–20 = 8°C.

Do this individually.
1. Calculate the diurnal range temperature when the highest temperature is 30°C and the lowest temperature is 10°C.
2. Calculate the mean daily temperature of a place whose maximum temperature is 30°C and minimum temperature is 10°C.
3. Calculate the mean annual temperature of the year 2014 from the Table 8.4.
Table 8.4

(e) Calculate the mean annual range of temperature from Table 8.4.Precipitation

Study the photography below and use it to answer the questions that follow.

Fig 8.191. Describe the weather condition of the day shown in Figure 8.19.
2. Why is rain important to humans?
Precipitation is the deposition of moisture in liquid or solid form. The moisture falls from the clouds in the atmosphere onto the earth’s surface. Moisture falls in the form of rainfall, dew, mist, fog, sleet, snow, haze, and frost.
Forms of precipitation

Do this individually.
1. Observe the weather conditions in your home area in the morning on your way to school for a month.
2. Identify the forms of precipitation that your area experiences. You can also state if it is a sunny month.
3. Share your findings in class.
(a) Rainfall
This form of precipitation is made up of liquid water droplets. The droplets fall from the sky after condensation. Condensation refers to the process by which water changes its state from vapour to liquid. The moisture rises into the atmosphere, cools down and forms water droplets. These droplets form clouds. They then get heavy and yield water droplets. The water droplets are pulled towards the earth’s surface by gravity and falls as rain.
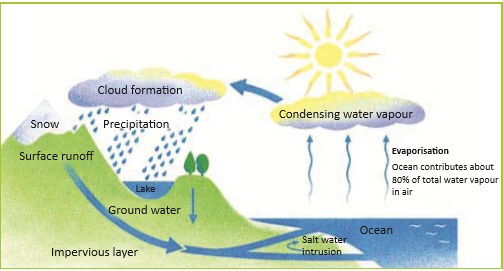
Fig 8.20 Formation of rainfall.
(b) Dew
During the night temperatures near the earth’s surface drop drastically. This makes moisture condense near the surface of the earth. The water droplets are formed on cold surfaces such as objects and vegetation. These droplets are called dew.
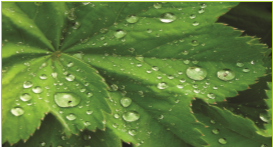
Fig 8.21 Dew
(c) Frost
When the temperatures are too low, the dew freezes. Frozen dew is called frost.

Fig 8.22 Frost
(d) Hoar-frost
In situations whereby the dew-point is below the freezing point, water moisture condenses directly. It then forms tiny ice particles on the cold surfaces. The ice particles are formed without passing through the liquid state. The process is known as sublimation.
(e) Rime
This refers to super cooled droplets frozen on the surface of telephone poles, wires, and trees. Rime has a white opaque form because of the air confined in ice particles.

(f) Fog
This refers to the cloud of visible aggregates of minute water droplets. They are usually suspended in the atmosphere near the surface of the earth.
(g) SnowThis is frozen water particles from the higher atmosphere. It is a form of solid precipitation that is formed by sublimation of water vapour. When air temperatures fall below 0°C, the moisture in the air condenses. It then forms small ice crystals known as snowflakes. The crystals are then deposited on the ground as snowfall.

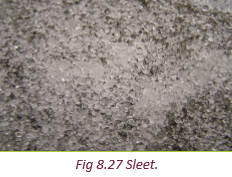
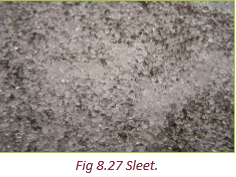
This is made up of a mixture of rain and snow or partially melted snow. The mixture then falls on to the surface of the Earth. Usually, this is formed when the surface of the earth is at or just above freezing point.
(i) Hail
This is frozen raindrops that build into spherical ice particles. It usually forms in the high clouds due to the uplift by convectional currents. As the raindrops are lifted higher by the rising air currents, they attract ice. They then begin to fall downwards due to the increased weight.

(j) Thunderstorm
This is a form of precipitation that is accompanied by thunder and lightning. Thunder is the explosion or bomb-like sound which occurs in the sky where there are thick clouds.
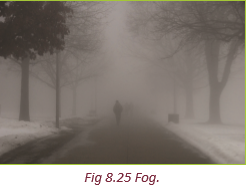
(k) Mist, fog, and haze
These terms have a direct relationship in terms of mode of formation. The difference is in the variations of how they affect the visibility of a given area.
Fog is used when the visibility is less than one kilometre.
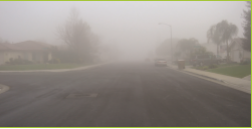
Fig 8.29 Fog.Mist is used when visibility extends to one kilometre.

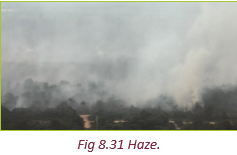
Haze is the term used when the visibility is limited to between 1km and 2km as a result of dust or smoke.
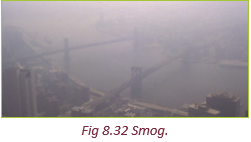
Smog refers to a mixture of fog and smoke. It is very common in industrialised countries like Germany and the Unites States of America.
Task 8.31. Define the term precipitation.
2. List and describe various forms of precipitation.
The water cycle

Work in groups of three.
1. Collect sauce pans, water and a charcoal stove or any other source of heat.
2. Put water in a sauce pan to boil.
3. When it starts boiling, get a cold lid and hold it above the sauce pan.
4. Note down your observations for a class presentation.
The water cycle is a continuous cycle where water evaporates into the air, forms clouds and falls down as precipitation. It then evaporates again and repeats the same cycle. It is a never ending cycle. Water keeps moving and changing its state from solid to liquid to gas over and over again. This process is also referred to as the hydrological cycle.
The water cycle process
Stage 1: Evaporation
The sun heats the surface of the earth. This heat makes water from the earth’s surface and plants to rise into the atmosphere. Water rises in the form of moisture or vapour through evaporation and transpiration.
Stage 2: Condensation and sublimation
The rising moisture reaches the upper parts of the atmosphere where temperatures are low. It then condenses forming tiny water droplets that result in the formation of clouds. Under the influence of gravitational pull, the water droplets fall down onto the earth’s surface. It falls in the form of precipitation. When the dew-point is below freezing point the water vapour turns directly into ice crystals. The crystals fall in the form of snow. The snow is formed by sublimation.
This is the process through which moisture freezes without changing into liquid.
Stage 3: Infiltration, percolation and over-land flow/run off

Work in groups of three.
1. Go outside your classroom. Pour some water on the ground and observe what happens after 10 minutes.
2. Move to a rocky area or an area that has concrete. Pour water on the ground and observe what happens.
3. Relate your observation to different types of soils that you learnt about.
4. Discuss your findings in class on the rate of filtration and penetration of water on different surfaces.
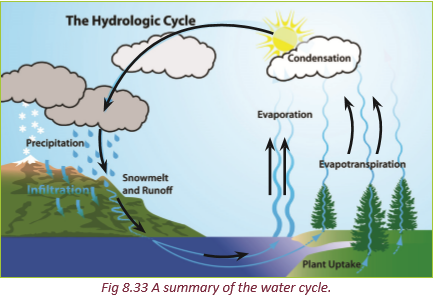
When the water droplets reach the earth’s surface, part of it infiltrates and percolates into the ground. This forms underground water.
The water finds itself back to the water bodies in springs and wells. When the soils are highly saturated, the water starts flowing onto the earth’s surface in form of run-off.
The water ends up into water bodies such as swamps, rivers, lakes, and oceans. Part of the infiltrated water is taken in by vegetation. When the sun releases its insolation it energises the processes of evaporation and transpiration. Moisture then rises back into the atmosphere. This whole process repeats itself. It is continuous.

Do this in pairs.
Study Figure 8.34 and answer the questions that follow.
Fig 8.34
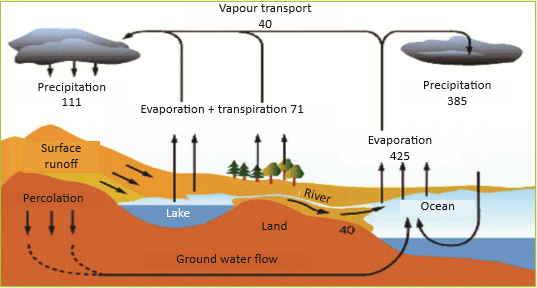
Fig 8.34
1. Describe what happens at every stage.
2. Explain what you think would happen if one process is omitted.
3. Suggest ways in which humans can maintain the water cycle in its normal state.
4. Record your findings and discuss them in a class presentation.
Types of rainfall

Read the passage below and aswer the questions that follow.
Manzi, Kasime and Shema are very good friends. The three friends come from different areas but study together in a boarding school in the Eastern Province of Rwanda. Manzi comes from Musanze District where there are many mountains. Kasime comes from Rubavu District near Lake Kivu. Shema’s home is near Nyungwe Forest.
1. In pairs, identfy the types of rainfall experienced in each of the areas where the students come from.
2. Explain the formation of the types of rainfall identified in (1) above.
3. Mention and describe the formation of type of rainfall that is expirienced in any of the areas mentioned above.
4. Advice the communities living in the areas mentioned on how to conserve the environment in order for them to continues receiving rainfall.
5. Discuss your finding in a class.
As you studied earlier, rainfall is one of the forms of the precipitation.
There are 3 types of rainfall.
- Relief (orographic) rainfall
- Convectional rainfall
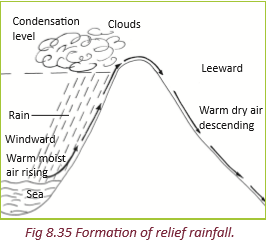
- Cyclonic (frontal) rainfall The relief (orographic) rainfall
Formation of relief rainfall
1. The prevailing winds pick up moisture from water bodies as they travel across, making the air moist.
2. The moist air is forced to rise over mountains and hills.
3. This forces the air to cool and condense, forming clouds.
4. The air continues to be forced over the mountains and so it drops its moisture as relief rain.
5. On the top of the mountain, the air drops down the other side. It warms as it drops.
This means it has a greater ability to carry moisture. There is therefore little rain on the far side of the mountain. This area is called the rain shadow.
Note
(i) The side of a mountain that receives rainfall is called the windward side. The side that does not receive rainfall is known as the leeward side. It is sometimes known as the rain shadow side.
(ii) The leeward side remains dry because it is bathed by a dry downslope wind. The moisture in the downslope wind is trapped and dropped on the windward side.
Areas in Eastern Africa where such rainfall is received include:
- The highlands of Rwanda – Northern and Western provinces
- Western side of Mt. Ruwenzori in Uganda
- Mt. Elgon
- Kenyan highlands.
 Convectional rainfall
This type of rainfall is very common in areas where the ground is heated by the hot sun. It mostly occurs in the tropics. This is why these areas experience heavy rainfalls most afternoons.
Formation of convectional rainfall
1. The surface of the earth is heated by the sun.
2. The warm surface heats the air above it. Hot air always rises so this newly heated air rises.
3. As it rises, the air cools and begins to condensate.
4. Further rising and cooling causes a large amount of condensation to occur and rain is formed.
5. Convection produces towering clouds, which produce heavy rain and possible thunder and lightning.
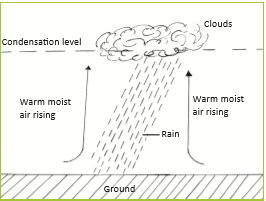
Fig 8.37 Formation of frontal rainfall

1. Describe the type of rainfall that occurs in your home and school neighborhood.
2. Using a well-labelled diagram, describe how it is formed.
3. Suggest ways in which the environment should be cared for to ensure reliable rainfall.
4 Discuss your findings in class.
Measuring rainfall

Work in groups of five with the guidance of your teacher.
1. Find out how to make a rain gauge.2. Make one for use in your school .3. Place it in an appropriate location within your school compound.4. Measure the amount of rainfall that is collected daily for two months.5. Calculate the daily rainfall totals and the mean monthly rainfall.Rainfall is measured using a rain gauge. A rain gauge has an outer cylinder within which there is a funnel that drains into a collecting bottle. A part of it is buried in the ground while the top part remains above the ground.
The following important conditions should be observed when placing a rain gauge in a place.- It should be situated in an open space where there are no trees, houses or buildings. The place should also be free of surface run off. This is to ensure thatbthe rain to be measured is as actual as possible. If it is placed under trees orbin front of houses, it will give wrong readings. This is because more water will collect in it.
- Part of the rain gauge (about 30 cm) should be left above the ground. This is to prevent the run-off and splash water from entering the measuring jar.
- The bottom part of the rain gauge should be partially buried. This is to reduce or stop any evaporation from the jar. If this is not done, part of this water collected in the jar can evaporate. This will happen when the temperatures are high.

Fig 8.38 The structure of a rain gauge
Measuring rainfall
Rainfall can be measured as:• Daily rainfall• Total monthly rainfall• Mean monthly rainfall• Total annual rainfall• Mean annual rainfallDaily rainfall
This is the amount of rainfall collected in a rain gauge at a weather station in a day.Total monthly rainfallThis is obtained by adding the figures of the daily rainfall for a period of one month.Table 8.5: Daily rainfall totals in April for Nyamirambo.

TR = traces
From Table 8.5 the rainfall total for the month of April in Nyamirambo is 266.1 mm.
Mean monthly rainfallMean monthly rainfall is calculated by adding all monthly rainfall totals for the year and dividing by 12.Table 8.6 Total annual rainfall.
Month J F M A M J J A S O N D Total Mean monthly rainfall in mm 26 10 61 202 322 107 88 65 56 84 94 60 1,181 Mean annual rainfallThis is the average rainfall of a place. It is calculated after a period of years such as 15 years. The annual rainfall totals are collected for a period of 15 years. They are then added and the sum divided by 15.Task 8.4
1. With help of appropriate illustrations, describe the major types of rainfall.2. Study the table below, showing areas which receive rainfall. Fill in the appropriate types of rainfall experienced.
3. (a) Explain how rainfall is measured.
(b) State reasons to why it is necessary to measure rainfall.4. Explain the factors responsible for the formation of rainfall.Atmospheric pressure

Work in pairs.
1. Define atmospheric pressure.2. State and explain the factors that influence atmospheric pressure.3. Discuss your finding in a class.Atmospheric pressure refers to the weight exerted by the atmosphere over the Earth’s
surface. Atmospheric pressure is greater on the ground surface and greatest at the sea level. It decreases with an increase in altitude. Atmospheric pressure varies from place to place.Factors that influence atmospheric pressure
Atmospheric pressure is influenced by three factors.- Altitude
- Temperature
- Rotation of the earth.
(a) Altitude
This refers to the height of a given place in relation to the sea level. Areas closer to the sea level support a high column of air above them. This air exerts much pressure.Hence, atmospheric pressure is higher in areas near the sea level and lower on the mountains.
Fig 8.39 Differences in atmospheric pressure.
(b) Temperature
High temperatures cause low pressure while low temperature cause high pressure. In hotwarm regions, heated air becomes lighter and rises. This causes low pressure.In areas with low temperature, air is cold and dense. The air sinks and exerts pressure on the surface. This causes high pressure.(c) The earth’s rotationDuring the rotation of the earth, air is thrown from the equator towards the poles. As the air moves towards the poles, it crosses over latitudes which are reducing in size. This leads to high pressure.On the other hand, air blowing from the polar region crosses over widening latitudes. This leads to low pressure.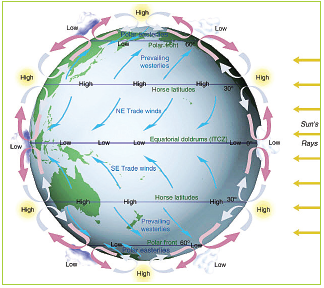
Fig 8. 40 Global pressure belts.

Locate zones of high and low pressure on the earth’s surface on the map shown below.

Fig 8.41
Measurement of atmospheric pressure
Study the diagram representing a mercury barometer and answer the questions that follow:
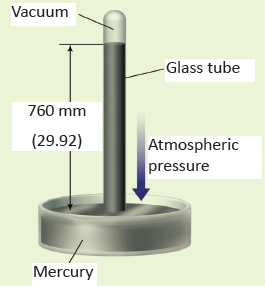
Fig 8.42
1. Explain why the arrow shown on the diagram points down wards.
2. What is the atmospheric pressure experienced in the area where the above mercury barometer was used?3. State the units used in measuring the atmospheric pressure.4. Explain how the above instrument operates.5. Discuss you findings in a class presentation.Atmospheric pressure is measured using an instrument called a barometer. It is measured in millibars.
There are two kinds of barometers. These are:(a) the mercury barometer
(b) the aneroid barometer.The mercury barometer
A glass tube graduated in centimetres or inches and closed at one end is filled with mercury. The tube is then inverted and the open end immersed into a dish of mercury.The mercury flows out of the tube into the bowl. It does so until the weight of its column is balanced by the pressure of the atmospheric pressure exerted on it. This means the mercury adjusts itself until its weight in the column is equal to the weight of the air pressure.When the pressure of the atmosphere increases, it exerts weight on the mercury in the dish. The mercury in the tube rises. The atmospheric pressure is obtained by reading the level of the mercury on the graduated tube. When the pressure decreases, the height of the mercury in the tube drops. The length of the column of mercury indicates the air pressure.
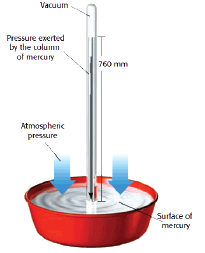
Fig 8.43 Mercury barometer
The aneroid barometer
This is a smaller and more portable barometer. It consists of a vacuum metal box or capsule with a spring inside. This spring prevents it from collapsing. One end of the spring is firmly fixed to the frame of the barometer. The other end is free to move with changes in atmospheric pressure. Alever is fixed to the movable end of the spring. The lever moves a pointer over a dial graduated in millimetres.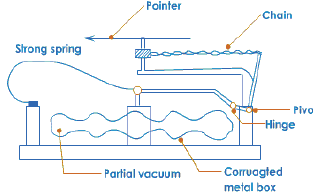
Fig 8.44 An aneroid barometer.
The metal bar or capsule is sensitive to pressure changes. It compresses when pressure increases and expands when pressure decreases. The spring in the box or capsule correspondingly moves. It allows the pointer to indicate the pressure of the atmosphere on the dial. The atmospheric pressure is obtained by reading the figure indicated by the pointer.
On some aneroid barometers, pressure is automatically and continuously printed on a revolving drum. This drum is inside the barometer. The pressure is printed on a graph known as a barograph.
Task 8.5
Use the diagram below to answer the questions that follow.
1. .(a) Name the pressure belts marked X, Y and Z.
(b) Explain the reason for the occurrence of the atmospheric pressure at location Y.(c) Why are polar regions associated with high pressure cells?2. State and explain any three factors that influence the atmospheric pressure of a given area.3. Explain the effects of atmospheric pressure on temperature and winds.4. Study the diagram below and answer the questions that follow
(a) Name the instrument.
(b) State the element of weather measured using the above instrument.(c) Explain how the above instrument works.Humidity

Read the short story below and answer the questions that follow.
Miss Batamuliza is a day scholar in one of the secondary schools in Musanze district. She walks for five kilometres every day to school. She passes through the rocky slopes that decorate the beautiful landscape of the region. She struggles to see what is ahead of her as she walks because of a cloudy substance that blurs her vision. This condition is a common occurrence in her area.One day she woke up earlier than usual. She wanted to go to school to do her assignment.
After walking for two kilometres, she was covered by the tiny water droplets that stuck to her hair.Despite the cold and the dampness, she still went on with her journey. In a few minutes, several droplets of water began rolling down her face. She thought it was drizzling. Her bag and sweater became damp.She soon reached school. She observed that some of her classmates who arrived after her were cold and damp. Later that day when she went home, she requested her parents to take her to a boarding school. She wanted to become a medical doctor like her brother.
(a) What were the tiny water droplets?
(b) As a geography student, explain what was taking place when water droplets started rolling down from Miss Batamuliza’s forehead.(c) Which element of weather caused Miss Batamuliza’s agony on her journey to school?(d) What was limiting Miss Batamuliza’s visibility?Humidity refers to the amount of water moisture in the air that surrounds the earth.
Humidity displays the degree of wetness of the atmosphere. It is one of the major influences of the atmospheric weather.The water vapour is obtained from water bodies and the ground surface through evaporation. It is also obtained from plants through transpiration. The amount of water vapour in the air largely depends on temperature, the size of water bodies present and prevailing winds. Places with large water bodies and high temperatures have high amounts of water vapour .Areas with no water bodies have little amounts of water vapour. Areas with low temperatures also have limited amounts of water vapour. Onshore and calm winds facilitate build up of water vapour on land. Offshore and very strong winds blow away water vapour from the land.
At any one time, at a given temperature, there is a limit to the amount of moisture that the air can hold. When this limit is reached, the air is said to be saturated.Warm air can hold higher amounts of water vapour than cold air. As a result, the amount of rainfall received from warm air is more than that received from cold air.Humidity is expressed either as absolute humidity or relative humidity.
(a) Absolute humidity

Your teacher will take you for a field visit to a weather station near your school.
1. Ask the resource person at the station to show you how to measure humidity using the instrument at the station.2. Measure the humidity in the atmosphere at the station.3. Record your findings.Absolute humidity refers to the actual amount of water vapour present in a certain volume of air at a given temperature. The absolute humidity is expressed in grams per cubic metre (g/m3). Absolute humidity is high when temperature is high. This is during the day and in summer. Areas that experience high temperatures throughout
the year have high absolute humidity. Such areas include the equatorial zones. This happens in areas with large water bodies and heavy rainfall.(b) Relative humidity
This is the ratio between the actual amount of water vapour present in a given mass of air to the maximum amount of water vapour that the same air can hold at the same temperature. It is expressed as a percentage.
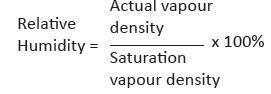
Suppose the actual vapour density is 47 and the saturation vapour density is 98. Calculate the
relative humidity.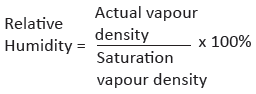
Then, the relative humidity will be calculated as follows:
The relative humidity in this case is 47.96%.
This implies that the same mass of air at the same temperature still requires 47.96% to reach saturation.Factors that influence the amount of humidity
The amount of humidity varies from time to time. It also varies from place to place. Thisvariation occurs due to the following factors.Precipitation
This plays a great role determining the quantity of humidity in the atmosphere.Areas that receive heavy rainfall regularly have more water moisture hence creating humid conditions. On the other hand, areas with arid conditions will have little or no water vapour.Air temperature
This determines the rate of evaporation and transpiration. When the temperatures increase, evaporation and transpiration increase too. These processes steadily supply the atmosphere with water vapour. The opposite happens when the temperatures decline.
The prevailing winds
Winds which are warm and moist carry a lot of water vapour to the areas they blow to.Cold and dry winds limit the level of humid conditions.Plant cover
Forested areas with dense vegetation cover have high humidity. This is due to intense transpiration and other related geographical aspects that increase water moisture. Areas with little vegetation cover have less humidity.The presence and size of water bodies Water bodies of reasonable sizes enable areas where they are located to have humid conditions. This is due to evaporation that continuously supplies water vapour to the atmosphere. Regions that have few or lack water bodies have less humidity dueto limited supply water moisture.Latitude
The amount of water vapour in the atmosphere is higher at the equator and the tropics. It is lower at the temperate and polar regions.Atmospheric pressure
The higher the atmospheric pressure, the lower the amount of water vapour in the air. The lower the atmospheric pressure, the higher the amount of water vapour.
Do this in pairs.
Use the Internet and geographical documents.1. Explain other factors that influence humidity.2. Record your findings and present them in a class discussion.Measurement of humidity
Humidity is measured by an instrument known as a hygrometer. Though there are a variety of hygrometers, the commonly used is the psychrometer. It is often known as the wet-bulb and dry-bulb hygrometer. There is a modern instrument also used to measure humidity. It has a self-recording system and it is called hygrograph.Wet-bulb and dry-bulb hygrometer
This has a muslin bag (wet-bulb hygrometer) that is kept wet all the time. When the moisture reduces through evaporation, latent heat also lowers. It cools the wet- bulb and as a result mercury contracts showing the readings. The dry-bulb hygrometer has no muslin bag. It is entirely affected by the moisture in the surrounding air.
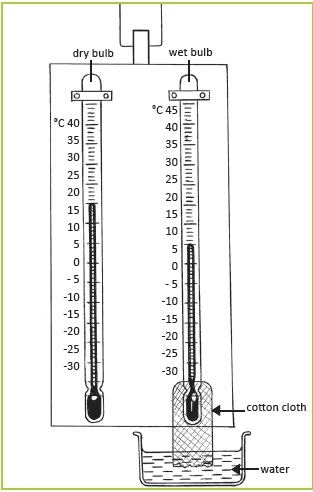
Fig 8.47 A simple hygrometer
Humidity levels are therefore derived from the difference existing between the two readings. This is when the air has not reached saturation levels.
Table 8.7 Interpretation of the readings of the psychrometer.
Nature of the readings Description of humidity levels A very big difference between the readings of the wet bulb and dry bulbhygrometers.Very low humidity A very small difference Humidity is high. The same readings The air is saturated. Winds

Go outside your classroom.
1. Observe trees and hanged clothes.2. Cut small pieces of leaves and put them down.3. Observe what happens to them.4. Throw chalk dust into the air.5. Record your observations for a class discussion.
Use the photographs provided below to answer the questions that follow
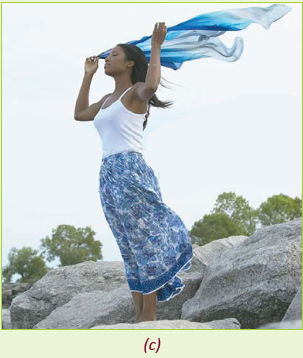
Fig 8.48
1. Describe the photographs (a), (b) and
(c) while relating them to weather conditions.2. In which photograph is air calm?3. Why do you think there are calm conditions in photograph (a)?4. Examine the effects of the element of weather identified in photographs (b) and (c).Wind is defined as moving air. Winds range from a gentle breeze to the fastest and most damaging winds. Wind plays a great role in influencing weather as well as climate. If there were no winds, it would be hard for water vapour to reach the upper layers of the atmosphere. Therefore, condensation would not take place and no clouds and rainfall could be formed. Wind moves from
a zone of low pressure to a zone of high pressure. It moves in a horizontal manner.Types of winds
There are essentially two types of winds.
- Local winds
- Global winds.
Local winds
Local winds are associated with specific areas. They are also directly influenced by the local environment. Such winds cover a small area. They include the following.
- Land breeze
- Sea breeze
- Katabatic and anabatic winds
- The Chinook/Fohn winds.
- The monsoon winds.
(a) Land and sea breezes
These are air circulations which occur locally along the shores of water bodies suchlakes and oceans. They are influenced by variations in temperatures between land and sea respectively.
Sea breeze
During the day, the land warms up faster than the neighbouring water body. The air over the land gets heated. It expands, becomes light and rises. Low pressure develops over the land surface. The water surface which takes a longer time to warm, remains cooler than the land surface. The
low temperature over the water surface leads to the development of a high pressure.
Wind therefore blows from the water body to the land.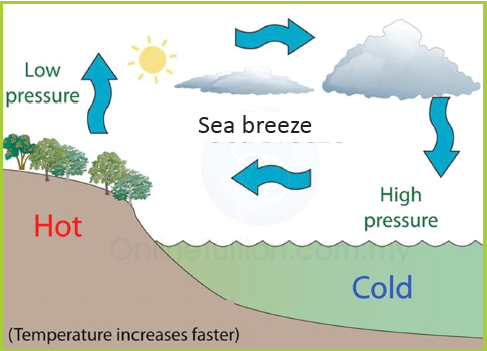

Fig 8. 49 Development of a sea breeze.
Characteristics of a sea breeze
• The wind is fairly strong.
• It blows in the afternoon from a water body towards the land.
This is because by this time both the land and the water body have been heated. This creates a distinct pressure difference.• The wind is relatively cool.
Land breeze
At night, the land cools faster then the sea. This leads to low temperature over the land. The air molecules over the land becomes heavy leading to development of high pressure. The warmer and lighter air over the water rises. This results into low pressure over the water body. Wind therefore blows from the land to the sea forming a land breeze.
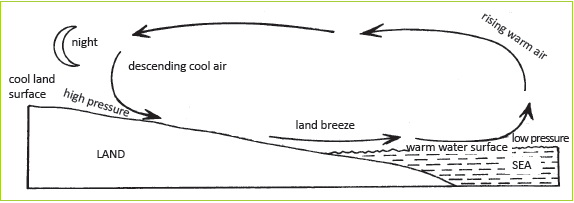
Fig 8.50 Development of a land breeze.
Characteristics of the land breeze
• It is a light wind.
• It blows at night.
• It is weak compared to a sea breeze. This is because the pressure difference between the water and the land surface is small.
Areas that experience these breezes include the areas near Lake Kivu, Lake Victoria and Lake Tanganyika.Weather conditions associated with land and sea breezes
(a) Sea breezes have cooling effects on the adjacent coasts on hot afternoons in the tropical regions.
(b) Sea breezes also lead to formation of convetional rainfall on the land in late afternoons. This is common in areas around Lake Victoria and the coastal regions.
(c) Land breezes lead to the development of heavy rainfall accompanied by thunderstorms and strong winds. This occurs on water at night.Katabatic winds
At night, the upper parts of mountains lose heat faster than the lowland areas such as valley bottoms. This creates a high pressure zone on the upper slopes and a low pressure cell within the valley.
The cold air from the upper slopes descends towards the valley. This air descends under the influence of gravity. The descending cold wind is called the katabatic wind. It is also sometimes known as the mountain breeze.

Fig 8.51 Development of a mountain breeze(katabatic winds).
Characteristics of mountain breeze
• It is cold and dense.
• It blows at night down a mountain slope.• It is gentle.
Weather associated with mountain breeze
(a) It creates a temperature inversion in the valley. The air above the valley bottom is warmer than the surface.
(b) It leads to formation of fog or mist in valleys in the early morning hours. These weather conditions are common in highland areas and escarpments bordering highlands.
(c) It causes frost and chilly conditions in the valleys.
(d) It is associated with dry conditions.Anabatic winds
During the day, the sun’s rays reach the mountain slopes more than valleys. This results into a low pressure zone along upper slopes. The air continues heating up and expands eventually rising into atmosphere.
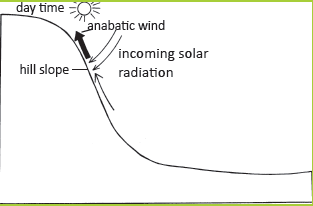
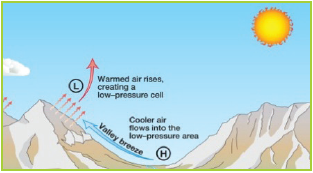
Fig 8.52 Development of a valley breeze (anabatic winds).
Within the valley, the sun’s rays are not intense. The cool conditions lead to the formation of a high pressure zone. The warm air is therefore forced to rise by the adjacent cooler denser air in the valley.
This allows cooler air from the valley to start rising against the slopes. The air rises to replace the warm air that expanded and rose. This is sometimes known as the valley breeze.Characteristics associated with the anabatic wind
• It is a warm light wind.
• It blows upslope during the day.Weather conditions associated with anabatic winds
(a) They lead to the formation of cumulo-nimbus clouds. These clouds yield heavy rainfall accompanied by thunderstorms on the mountains.
(b) The valley remains without mist or fog.The Chinook or Fohn winds
These winds are formed when the warm moist winds blow against the mountain. As they blow, they drop the moisture in form of precipitation on the windward side. After moisture is dropped, winds descend on the leeward side. They begin to warm up due to adiabatic compression.
These winds are dry and warm leading to dry conditions along the leeward side of the mountain. The chinook is an American word which means “snow eater”. This is because the wind is associated with rising temperatures that result into snow melt. When these winds are still on the windward side they are not yet chinook. These winds are common on the eastern slopes of the Rocky Mountains in the USA and in the Alps Mountains in southern Europe. They are called the Fohn winds in the Alps and Chinook in the Rocky Mountains.
Fig 8. 53 Fohn wind descends the mountain as a warm dry wind.
The monsoon winds
A monsoon is a seasonal shift in the prevailing wind direction. It usually brings with it a different kind of weather. Monsoons cause wet and dry seasons throughout much of the tropics. They are
often associated with the Indian Ocean.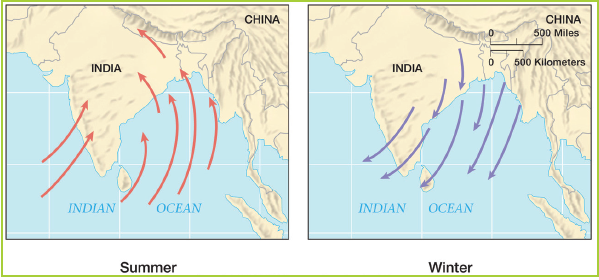
Fig 8.54 The direction of the monsoon winds in summer and in winter.
Monsoons always blow from cold to warm regions. The summer monsoon and the winter monsoon determine the climate for most of India and Southeast Asia. It blows from the southwest in summer and from the northeast in winter. In India and nearby lands, the season during which the southwest monsoon blows has heavy rains.
The harmattan wind
This wind originates from the Sahara desert. It is associated with a lot of dust. It usually results into a decrease in temperatures due to the dusty haze created. When it occurs, visibility is reduced to a kilometre or even less.
Fig 8.55 The harmattan wind.
Sirrocco winds
These are hot winds carrying large quantities of dust in North Africa. They usually blow between February and June. They share similarities with the harmattan winds.
Do this in pairs.
1. Use the Internet and geography textbooks to find out other examples of local winds.
2. Describe their characteristics and effects on land where they occur.
3. Record your findings and present them during a class discussion.The global winds

1. Describe the different types of global winds.
2. Locate the global winds by filling in the names of the winds in the map of Figure 8.56.
These winds operate between latitudes and cover a huge area or region. They include
the following.
The trade winds
The westerlies
The polar easterlies
As earlier mentioned, global winds cover a larger region and interplay between latitudes.Trade winds
The trade winds are the easterly surface winds found in the tropics. They are found within the lower portion of the earth’s atmosphere near the earth’s equator. The trade winds blow predominantly from the northeast in the Northern Hemisphere. They form the North-east trade winds.
They also blow from the south-east in the Southern Hemisphere. Here they form the south-east trade winds. They strengthen during the winter and when the Arctic region is in its warm phase.They blow from the subtropical high towards the equatorial trough. They migrate with the pressure belts north and south of the equator.

Fig 8.57 Trade winds.
The westerlies
These are prevailing winds that blow from the west toward the east in the middle latitudes. They blow between latitudes 30 and 60 degrees. They originate from the high-pressure areas in the subtropical latitudes and blow towards the poles.
The westerlies are strongest in the Western Hemisphere and at times of low pressure over the poles. They are weakest in the Southern Hemisphere and when pressures
are higher over the poles. The westerlies are particularly strong in areas where land is absent. This is because land intensifies the flow pattern, making the current to flow in a north – south direction. This action slows down the winds. The strongest westerly winds in the middle latitudes occur between the 40 and 50 degrees latitudes.
The westerlies carry the warm, equatorial waters and winds to the western coasts of continents. This happens more in the Southern Hemisphere because of its vast oceans.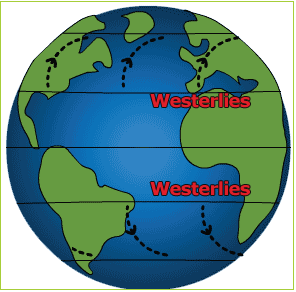
Fig 8.58 Westerlies.
The polar easterlies
The polar easterlies are the dry, cold prevailing winds that blow from the highpressure areas of the north and south poles towards low-pressure areas. Cold air subsides at the poles creating the high
pressure. This pressure causes air to flow outward towards the equator. The outflow is then deflected westward by the Coriolis effect. This results in the easterlies.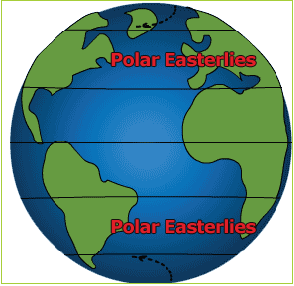
Fig 8.59 Polar easterlies.
Table 8.8 below shows a summary of the global winds.
Table 8.8 Global winds
Wind system Description The polar easterlies • Their origin is in the polar regions.
• They blow towards the temperate areas 60° north or south of the equatorThe westerlies • They originate from the sub-tropical high pressure zone.
• They move towards the temperate low pressure belts.
• They begin as south westerlies but deflect hence generally named westerliesThe northeast trade winds • They begin from the sub-tropical high pressure zone.
• They move towards the equatorial low pressure areas.
• They are only found in the Northern Hemisphere.
• They are situated within 30°N.The southeast trade winds • They originate from the sub-tropical high pressure zone.
• They blow towards the equatorial low pressure areas.
• Their latitudinal location is within 300S.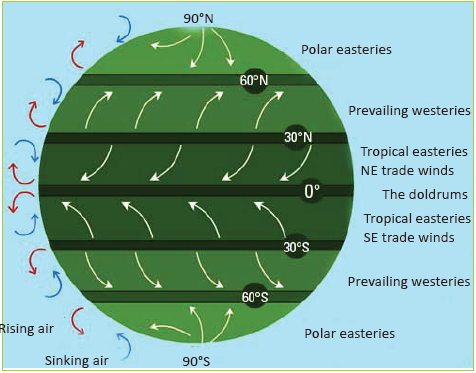
Fig 8.60 Global winds.
Measurement of wind
Wind is measured in terms of direction and speed. The instruments used in these measurements are:
- wind vane for wind direction
- cup anemometer for wind speed
- wind sock for the wind strength and direction.
Wind vane

Work in groups of five.
1. Use local materials from your environment to make a wind vane.
2. Place it in a place where wind direction can be determined.
3. Read the direction of the wind and share your findings in class.This is an instrument used to show wind direction. It has a pointer that looks like an arrow with a broad base. The head always points to the direction of the wind.
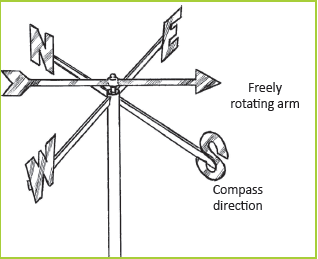
Fig 8.61 A wind vane.
The direction of wind is always determined as the direction from which the wind blows.
For example, wind blowing from west to east is always defined as west wind.
Modern wind vanes are electronically connected to a calibrated dial. The dial has degrees and compass directions, as shown below:
East wind is specified as 90°
South wind is specified as 180°
West wind is specified as 270°
North wind is specified as 360°Cup anemometer
This is the most accurate instrument used in measuring the speed of wind. It is accurate especially in measuring the horizontal wind speed. The cup anemometer has cups which when blown by the wind, generate a weak electric current. The current drives the pointer that is connected to standardized readings on a dial. The readings are in metres per second, kilometres per second or miles per second.
The more the wind speed, the more the rotations and generation of electric current.
Hence, the pointer will point on high metre readings.
Fig 8.62 Cup anemometer.

With the guidance of your teacher, visit a
weather station near your school.
1. Identify a cup anemometer at the station.
2. Ask the resource person to show you how to read the speed of wind.
3. Read the wind speed at the weather station.
4. Record your findings.The windsock
The windsock measures the strength and direction of wind. When the wind’s strength is weak, the sock points downwards. When it is great, it blows out almost at right angle.
Windsocks are mostly used in airports.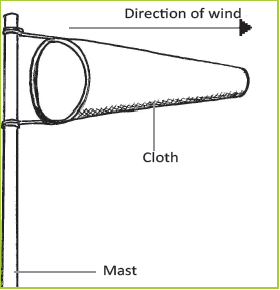
Fig 8.63 Windsock.

Work in groups of three.
1. Tie a paper bag onto a long pole or stick.
2. Place it firmly in a good place where the winds can reach.3. Determine the wind direction using a compass.
4. Observe its behaviour and record down your observations.
5. Use the findings in class discussions.Task 8.6
1. Define wind.
2. (a) Explain how winds influence the climate of a given area.
(b) With the help of diagrams, describe how the following are measured.
(i) Wind direction
(ii) Wind speed
(iii) Wind strength
3. Distinguish between the following.
(a) Land breeze and sea breeze.
(b) Hamattan and Sirocco winds.
(c) Katabatic and anabatic winds.
4. (a) With the help of a diagram, describe how the chinook winds are formed.
(b) Examine the effects of Chinook winds in areas where they occur.Clouds

Do this in pairs. Go outside the classroom and look up into the sky. What do you see?
1. Note down the colour and characteristics of the sky above you.
2. Write down the findings.
3. Draw and colour the sky that you have observed.
4. Have a class for a discussion on your observations.Clouds are tiny water droplets or ice particles suspended in the air. They form when water vapour condenses into water droplets or ice crystals. They condense around particles such as smoke, dust or salts that are found moving in the atmosphere.
Types of clouds
Clouds are classified according to their height, appearance, shape and altitude.
They are generally classified into four.- High clouds – 6,000 to 12000 metres
- Middle clouds – 2,100 to 6,000 metres
- Low clouds – below 2,100 metres
- Clouds of great vertical extent – 1,500 to 9,000 metres
High clouds
Clouds Characteristics Cirrus • They are made of crystals that give them an appearance of white colour.
• They are the highest clouds in the atmosphere.
• They are thin and detached.
• They are feathery with tail filaments.
• They yield no precipitation.Cirrocumulus • They are made of ice crystals.
• They are white in colour.
• They look like soap foam.
• They are made of thin layers and rows of rounded masses with a ripple appearance.
• They yield no precipitation.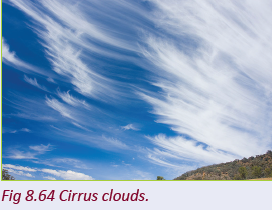

Cirrostratus • They are made of ice crystals which give the clouds a milky appearance.
• They are thin veil-like sheets or layers that cover much or all the sky.• When the sun or moon shines through them they form a ring of light around (halo).

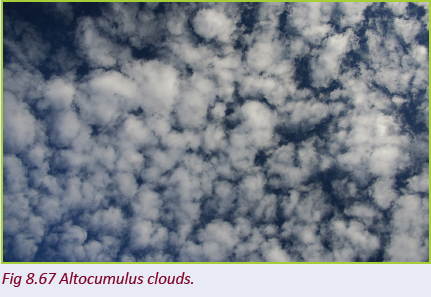
Middle clouds Altocumulus • They consist of water droplets and some ice crystals.
• They are whitish-grey in colour.
• They form waves of lumps separated by patches of blue sky.
• They look like piled up cotton wool.
• They have flattened bottoms.• They yield small amounts of precipitation.
Altostratus • They consist of water droplets and some ice crystals.
• They are grayish in colour.
• They form uniform sheets of watery-looking clouds. These sheets
partly or totally cover the sky, reducing the brightness of the sunor the moon.

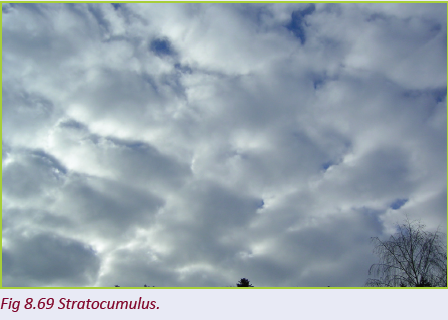
Low clouds Stratocumulus • They mainly consist of water droplets.
• They are dark grey or smoky in colour.
• They are large globular and bumpy looking with an appearance
of long rolling rows.• They occasionally yield showers.
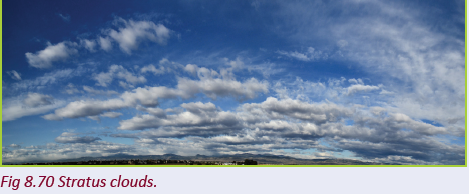
Stratus • They consist of water droplets.
• They form a low uniform layer resembling fog.
• They are greyish white in colour.• They are associated with dull weather and drizzle.
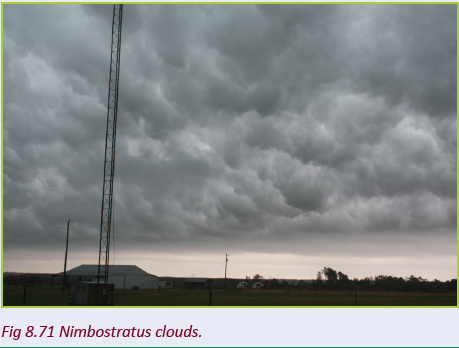
Nimbostratus • They consist of water droplets.
• They are thick and dark grayish-black in colour.
• They are shapeless and may have darker patches beneath them.• They yield continuous rain.
Clouds of great vertical extent Cumulus • They consist of water droplets.
• They are thick white clouds.
• They have a flat base and sharp outlines.
• They occur as isolated heaps. They look like cauliflower or heaped cotton wool.
• They develop into a thick vertical extent because they are convectional in type.• They are associated with intermittent sunshine and occasionally short-lived showers.

Cumulonimbu • They are made of water droplets at the lower levels and ice crystals at the highest levels.
• They have a great vertical extent rising from a height of about 2100 metres to 9000 metres above the ground.
• They are big, heavy and black in colour with a flat base.
• The top of the cloud spreads out assuming the shape of an anvil.
• Cumulonimbus clouds are associated with convectional currents which create rapid movement and mixing of air particles, leading to very heavy rainfall accompanied by thunder and lightning.• They are associated with rain showers and hail. The showers are heavy and violent.


Fig 8. 74 Clouds at different altitudes.
Work in groups of three.
1. Go outside your classroom.
2. Look up into the sky.
3. Identify the different types of clouds that are up in sky.
4. Give the correct characteristics of the clouds that you identify.
5. Draw and colour the clouds identified.
6. Present your findings in a class discussion.
Sunshine
Your teacher will take you for a visit to a weather station.
1. Identify a Campbell-Stokes sunshine recorder.
2. Ask the resource person at the station to show you how to measure sunshine.
3. Measure the sunshine at the station at that particular time.
4. Explain how you can measure sunshine in your school using a Campbell-Stokes sunshine recorder.
5. Record your findings.
6. Discuss them during a class presentation.
This is the light or solar radiation that is received on the earth’s surface from the sun. The amount and duration of sunshine received on the earth’s surface is determined by:
• cloud cover
• aspect
• latitude.
Thick cloud cover reduces the amount of sunshine and consequently its duration. The sunshine is more intense when the sky is clear.
In the Northern Hemisphere, the south facing slopes receive more sunlight than the north-facing slopes. Places near the equator get more sunlight than polar regions. The amount of sunshine in a place is recorded as a mean of sunshine hours per day.Sunshine is measured using an instrument
called the Campbell-Stokes recorder.
Campbell-Stokes sunshine recorder
This is a glass which has a sensitized calibrated paper on a metal frame.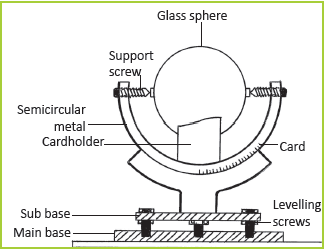
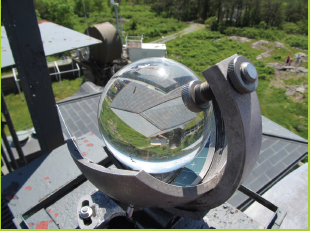
Fig 8.75 A Campbell Stokes sunshine recorder
The glass is put in a position where it is possible for the sun’s rays to focus on the sensitised paper. When the sun shines, the paper is burnt and produces a burnt line.
In case the sunshine is continuous, a line will be completely burnt. If there are some variations, some gaps will be shown. All parts of the burnt line are then added up to determine the number of hours of sunshine.
Factors that influence climate
Use the geographical knowledge that you have so far gained about climate.
1. Find out and give factors for the variation of the following elements of weather and climate in the area near your school.
• Rainfall
• Pressure
• Temperature
• Humidity
• Rainfall
• Sunshine
• Wind
2. Write a detailed report on the factors given.
3. Present your findings in a class discussion.
Some of the factors that influence climate include the following:
(a) Latitudinal location
The latitude of an area determines the amount of the sun’s insolation received in the area. The movement of the sun is specific. When it is overhead in a given area the temperatures increase. It is for this reason that the equatorial regions are warmer than the temperate and polar areas.
(b) Altitude
This has a direct influence on temperature, precipitation and atmospheric pressure.
Areas that are mountainous and hilly have a cool climate. The atmospheric pressure at high altitudes is also low.
(c) Presence and absence of water bodies
These two factors modify the climatic conditions of areas. Areas that are near water bodies are humid. On the other hand, areas which lack water bodies are less humid thus have unreliable rainfall. This is with the exception of mountainous areas.
(d) Vegetation
Areas with dense vegetation such as the Amazon and Congo Basins, experience heavy rainfall and humid conditions. This is due to the steady supply of water vapour due to transpiration. On the other hand areas with no vegetation experience arid conditions. It is for this reason that it is
important for us to conserve our forests .
(e) Distance from the sea
Regions neighbouring the sea experience maritime climate. When the sea water is warm, the coastal areas also experience warm conditions. These conditions increase the rate of evaporation and rainfall is formed. Areas far away from the sea may experience less rainfall.
(f) Human activities
Human activities greatly influence the climates of different regions. Activities such as mining, deforestation and lumbering have negative effects on climate.
(g) Ocean currents
Warm ocean currents carry warm conditions to the neighbouring areas. The currents are associated with warm, wet winds that lead to wet conditions. On the other hand, cold ocean currents cause cold temperatures.
They are usually are associated with cold, dry winds that increase the arid conditions of the areas.
The nature of the land has a direct influence on climate. For example, hilly and mountainous areas are associated with orographic rainfall. However, it is only on the windward side that constant rainfall is experienced. The leeward sides experience dry conditions. These conditions are due to
the warm, dry descending winds.
Do this in pairs.
1. Observe the area around your home and school.
2. Identify the human activities going on in the areas around your home and school
3. Explain how the human activities influence the climate of the areas.
4. Explain how the climate influences the human activities that are carried out in the two areas.
5. Use geography textbooks, journals and the Internet to find out other factors that influence weather and climate.
6. Compile a report of your findings and present them in class.
Project work.
Do this as a class.
1. Design a project that will assist the communities around your school to conserve and protect the environment.
2. Present your reports and recommendations to the community heads through your teacher.
Task 8.7
1. Outline the factors that influence humidity in a given area.
2. Explain the following types of precipitation:
(a) rainfall
(b) sleet
(c) snow
(d) frost
3. Describe the characteristics of the following types of clouds:
(a) cirrus
(b) stratus
(c) cumulus nimbus.
4. Differentiate between mist, fog and hail stones.
5. Explain the type of rainfall received at:
(a) the equator
(b) Mt. Karisimbi.
(c) Write down the observations for a class discussion.
Climate zones are areas with distinct climates. They occur in the east-west direction around the Earth. These areas are classified using different climatic characteristics. Climate zones are belt shaped and circular around the poles.
In some areas, climate zones can be interrupted by mountains or oceans. The
world has different climatic characteristics in different regions. These variations in climatic patterns makes it possible to divide the world into different climatic zones. The classified zones are not perfect but they work. Basing on the climatic differences, there are four major climate zones of the
world.
• Tropical zone
• Temperate zone
• Polar zone
• Mountain zone
Tropical zone
This is the zone between latitudes 0° and 23.5°. This is between the tropics.
The region between the equator and the tropics is known as the equatorial region.
In this region, solar radiation reaches the ground vertically at specific times daily throughout the year. It is therefore very warm in these regions. Due to the high temperatures, more water evaporates and the air is often moist. The resulting frequent and dense cloud cover reduces the effect of the solar radiation on ground temperature.
Characteristics of the tropical climatic zone
• It is in the area around the equator, from 23.5° farther north to 23.5° in the southern latitude.
• The sun is at its zenith (90°) at least once per year. It is never lower than 43°.
• The average temperatures are between 20°C and 30°C.
• The minimum temperature is 0°. There is no frost.
• The maximum temperature is more than 40°.
• The radiation is positive.
• The day length is between 10 and 13.5 hours.
• The rains are defined by the trade winds. Its a seasonal shift.
• The climate is humid and warm.There is often precipitation.
• There are ever green forests and savannahs.
• More than 40% of the earth’s population lives in the tropics. This population keeps increasing.
The subtropics zone
This is the zone between latitudes 23.5° and 40°. The subtropics receive the highest radiation in summer. This is because the sun’s angle at noon is almost vertical to the earth. The cloud cover is also relatively thin.
These regions receive less moisture. This condition increases the effect of radiation.
Therefore, most of the deserts in the world are situated in this zone. In winter, the radiation in these regions decreases significantly. It can temporarily be very cool and moist.
Characteristics of the subtropics climatic zone
• It lies in the area between the tropical and the temperate zones (25° to 40°
North and South latitudes).
• The sun’s angle is at 9° to 27° above the horizon, according to place and season.
• The average temperatures range between 20°C and 35°C.
• Its minimum temperature is – 5°C.
• Its maximum temperature reaches +66°C in areas like Libya, Iran and the Death Valley.
• Its radiation is neutral.
• The day length ranges between 9 and 15 hours.
• It is generally dry with some humidity during winter.
• It has a tropic summer and non-tropic winter climate.
• It has semi-deciduous or evergreen forests, hardwood forests with winter rain, savannah, pasture land. It also has semi-deserts, warm temperate moist forests, nemoral deciduous forests.
• It has extreme heat, strong precipitation and drought in some areas.
Temperate zone
This is the zone between latitudes 40°and 60°. Here, the solar radiation arrives with a smaller angle. The average temperatures here are much cooler than in the subtropics.
The seasons and day length differ significantly in the course of a year. The climate is characterised by less frequent extremes.
There is a more regular distribution of the precipitation over the year. There is also a longer vegetation period.
Characteristics of the temperate climatic zone
• It is in the area between the cold zone and the subtropical zone (40° to 60°).
• The maximum angle of the sun is at 73° and minimum 0° (at the Arctic Circle).
• The average temperatures is between 0°C and 20°C.
• The minimum temperature is at –40°C.
• The maximum temperature is at + 40°C.
• The radiation balance is negative.
• The day length is between 4 to 16 hours and 8 to 12 hours at 50°.
• The precipitation is from 300 mm to 2000 mm with an average of 800 mm.
• The climate is warm and cold temperate.
• The vegetation is deciduous forests, warm temperate forests and savannah.
• Extreme temperatures and precipitation are rare.
Polar zone
This is the zone between latitudes 60° and 90°. The polar areas between 60° latitude and the poles receive less heat through solar radiation. This is because the sun has a very flat angle toward the ground. Because of the changes of the earth’s axis angle to the sun, the day length varies most in this zone. In the summer, polar days occur. Vegetation is only possible during a few months per year and even then is often sparse. The conditions for life in these regions are very hard.
Characteristics of the polar climatic zone
• It is in the area between 60° to 90° North and South latitudes.
• The maximum angle of the sun is at 53° above the horizon (polar day) to under the horizon (polar night).
• The average temperatures are between – 47°C and 0°C.
• The minimum temperature is at – 89°C (Antarctica).
• The maximum temperature is at +25°C (Tundra).
• The radiation is negative.
• The day length is between 0 and 24 hours for polar night and day respectively.
• Precipitation is variable and is mostly in the form of snow.
• There is ice climate with the average temperature of the warmest month below 0°C and tundra climate with the average temperature of the warmest month between 0 under 10°C.
• The vegetation in the area is scarce. There is moss, lichens, grass, boreal forest with conifer woods.
• The area is hostile to life.
Mountain zone
This climatic zone is also referred to as the alpine or highland climatic zone. In this
zone, no month has a mean temperature that is higher than 10°C. The climate becomes colder at high elevations than the surrounding lowlands.
Although this climate classification only covers a small portion of the earth’s surface, mountain climates are widely distributed.
The altitude where alpine climate occurs varies with latitude. For example, at 68°N in Sweden, mountain climate occurs as low as 650 metres, while on Mount Kilimanjaro in Tanzania, it occurs at 3,950 metres. In mountainous areas with an alpine climate, the dominant vegetation is the
alpine tundra. This consists of vegetation that does not contain trees because it grows
in very high altitudes. This type of climate is experienced in areas like:
• The Ethiopian Highlands
• The Alps of Europe
• The Himalayas of Asia
• The Andes in South America
• The Rockies in North America
• The Kenyan highlands
• Mount Kilimanjaro
Characteristics of mountain climatic zone
• It is distributed all over the world.
• This type of climate is greatly influenced by relief and altitude.
• Due to variations in temperature, it has a wide range of micro-climates.
• Temperatures decrease with altitude. The higher one goes, the cooler it becomes.
Fig 8.76 Climatic zones of the world.
• During the day, temperatures rise while in the night, they fall. This is due to excessive radiation.
• There is minor annual temperature range. Temperatures tend to be constant for most part of the year.
• The heavy precipitation is received on the windward side of the mountain. The leeward side has no rainfall and temperatures tend to be high.
• Atmospheric pressure decreases as one ascends.
• Temperature inversion is a common in these areas.
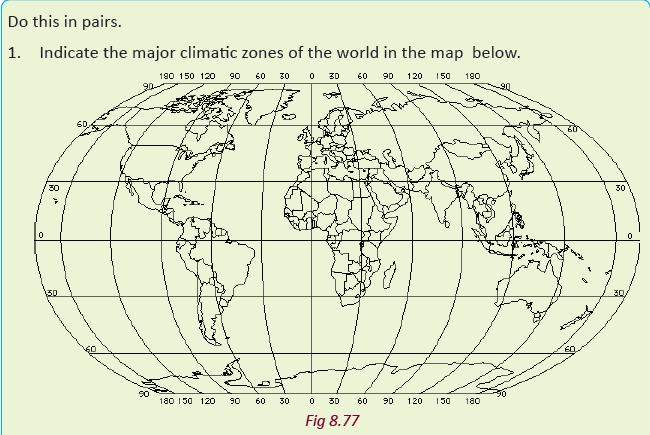
2. Justify your locations by describing the characteristics of the zones that you have indicated on the map.
3. Present your work in a class discussion.
Impact of weather and climate on human activities
Study the photographs provided below.
Fig 8.78 Crops growing in a farm in Musanze district.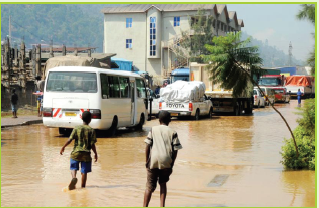
Fig 8.79 Children wading through a flooded street in Nyabugogo area in Kigali.
1. List the differences in the pictures.
2. What are some of the causes of the floods in Nyabugogo area?
3. Discuss your findings in class.
The weather and climate play a huge role in determining the human activities that can take place. For example agricultural activities are directly influenced by the climate. The following points show how weather and climate impact human activities.
(a) High and reliable rainfall in moderate levels supports the growth of crops.This ensures food security.
(b) Moderate and abundant rainfall supports growth of grass hence favouring livestock farming. It also supports herbivorous wildlife hence developing the tourism sector.
(c) Heavy and reliable rainfall supports the growth of trees of high value. This leads to the development of forestry and lumbering.
(d) The warm tropical climate attracts many tourists who come to enjoy the warmer conditions when they have winter conditions back home. This supports the tourism sector.
(e) In areas where with arid climates, humans are forced to find ways of irrigating the crops.
(f) Heavy and reliable rainfall sustains water bodies like rivers, swamps, lakes and wetlands. All these support aquatic life, tourism sports and provide water that is used for domestic purposes.
Work in pairs.
Use your local environment, the Internet and other geographical material.
1. Find out other influences of weather and climate on human activities.
2. Discuss and note your findings down.
3. Share them with your classmates in a class presentation.
Did you know?
• The South Pole is the least sunny place on earth.
• Antarctica is the least rainy place and not deserts.
• The shape and colour of clouds can help you predict rain
• Ice plays an important role in regulating climate, because it is highly reflective.
• Without the sun, there would be no weather.
1. (a) Distinguish between weather and climate.
(b) List the elements of weather and climate.
2. (a) Define atmosphere
(b) Briefly describe the layers of the atmosphere.
3. (a) Explain the water cycle processes.
(b) Identify different forms of precipitation.
4. Explain the factors influencing atmospheric pressure variation.
5. Identify the different types of winds.
6. State the different types of clouds.
7. Outline the factors that influence climate.
8. (a) Name the major climatic zones in the world.
(b) State the characteristics of alpine climate.
9. Explain how climate has influenced human activities in the world.