UNIT 1 CROSS SECTIONS AND SKETCH MAPS
UNIT 1: CROSS SECTIONS AND SKETCH MAPS
Key unit competence:
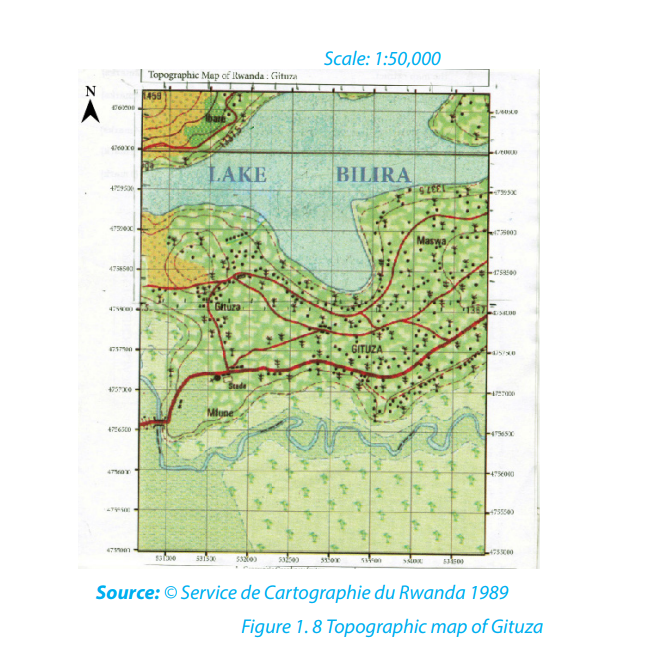
By the end of this unit, I should be able to draw cross sections and sketch maps byreduction or enlargement.Introductory activityUsing the previous knowledge and skills acquired in S4 and S.5, study the extractof the topographic map of Rwanda provided below to answer the followingquestions: 1. Use the above map to measure the distance from X to P2. Describe the relief on the map above1.1. Contour, contour interval and importance of contours
A contour is a line drawn on a map joining all the places with the same height above
sea level.
Contours cannot cross each other because each has its own fixed height and they
can be close to one another in case of steep slopes. Contours are drawn at constant
intervals known as the contour interval (CI). This is also called Vertical Interval (VI).
Contour interval is the difference in height between two adjacent contour lines.Contours are labeled from the lowest to the highest altitude as shown below.
In the study of geography, contours are important to analyze the landforms:
- They help to identify landforms like hills, plateaus, mountains and valleys on a
topographic map by analyzing the contour patterns formed by contour lines.
- Hills/mountains on a topographic map are shown as concentric rings of contours
with the highest values in the middle.
- In cases where contours are very close to each other, the relief of the area is steep.
When contours are separated by a wide space that shows a flat land.
Application activity 1.1
Use the topographic map provided below to describe contours represented onthe map and their interval.
1.2. A cross-section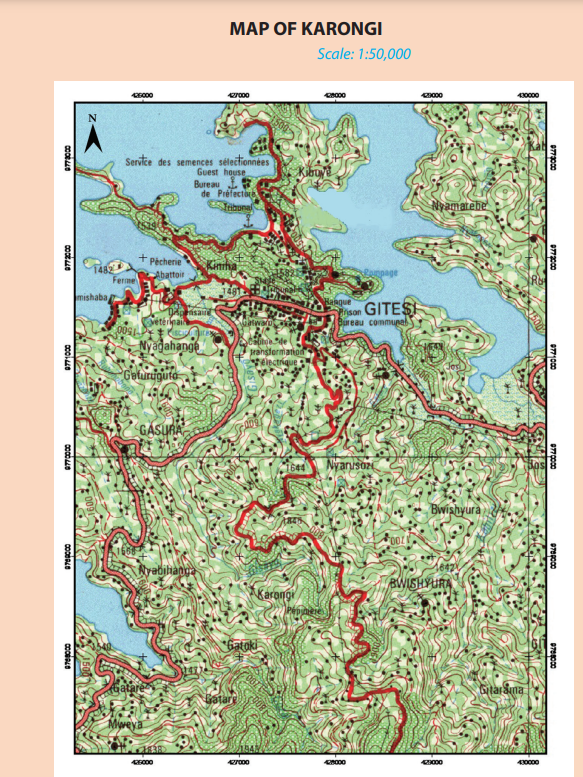
Learning activity 1.2
Use the topographic map provided below to identify flat slopes, gentle slopesand steep slopes.
A cross section is a topographical profile drawn between two points taken along a
straight line. It normally shows changes in relief of the area indicated by two points
on a topographic map.
When drawing a cross section, the following steps are followed:
• Determine the beginning and the end points of the section.
• Draw a straight line lightly in sharpened pencil from one point to another.
• Place a piece of paper with a straight edge along the pencil line.
• Mark the contour values and other important information like rivers,
settlements, roads, on the paper.
• Transfer the information on the paper to your graph paper and mark the point
on the cross section.
• Construct a frame with two vertical lines whose baseline is equivalent to the
length of the line between the two points marked on the map.
• Join all the points with a curved line following the dots on the paper to decide
the bends of the line.
An example of drawing a cross section is given on the map below. The area of study
is represented by the line between point A and point B.
To do this exercise, consider the following steps:
• Place a piece of paper on a map above along the line marked A and B
• Mark all the contours heights on the paper as shown below
The map below indicates further steps followed in recording contours on paper.
These contours indicate elevation and distances in two dimensions.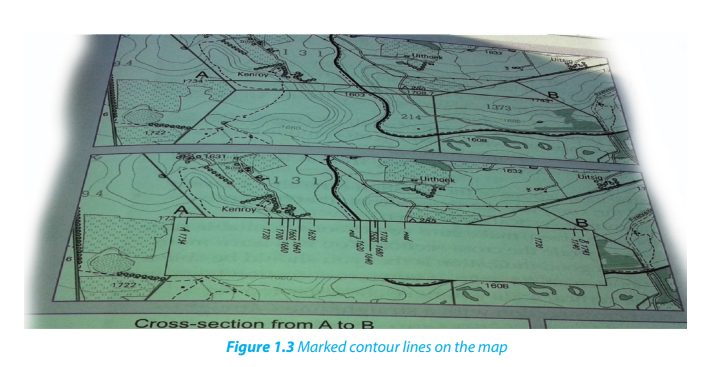
• Draw two vertical lines at each end of the horizontal line, these will represent
the Y -axes where the mark off the vertical scale will be made.
• Label point A and point B on the other end of the horizontal axis.
• Use the information on the paper to mark the highest and lowest heights
marked along the line A and B.
• Label the horizontal axis by writing the horizontal scale
• Label the vertical axis by writing the vertical scale.
• Write a title of the cross-section: cross-section from point A to point B
• Join all the dots on the graph using a free-hand line.
• Make sure the cross-section line links to points A and B on the vertical axes
1.3. Determining vertical exaggeration, the gradient, amplitude and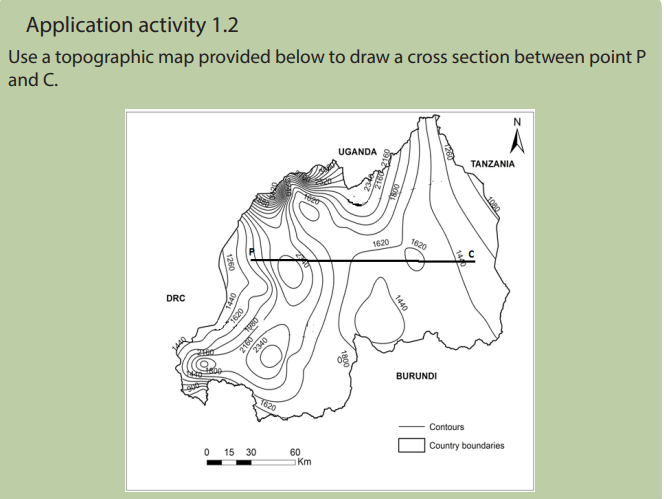
inter-visibility
Learning activity 1.3
1. Using different types of maps identify and explain different types of
scale.
2. Make research and explain the meaning of these terms: a) Vertical
exaggeration b) Gradient
1.3.1. The vertical exaggeration
The vertical exaggeration is the relationship between the vertical scale and horizontal
scale. It is calculated after drawing a cross section.
• To determine the vertical scale, refer to the scale given when asked to draw
a cross-section, e.g. 0.5 cm represents 20 m. This scale needs to be converted
into centimeter units to be used in the formula.
0.5 cm = 20 m
0.5cm = 2000cm
5cm = 20,000cm
1cm = 4000cm
Therefore, 1cm represents 4000 cm
• On topographic maps, the horizontal scale is most of time the same 1: 50,000,
i.e. 1 cm represents 50 000cm.
• As all units have been converted into centimeters, insert these measurementsinto the formula.
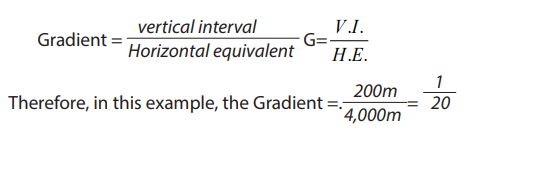
1.3.2. The gradient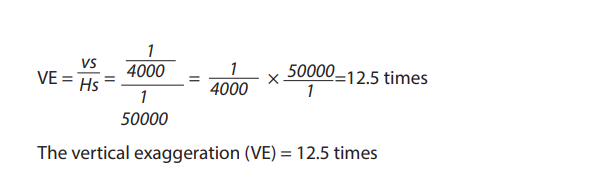
Gradient refers to the steepness of a slope between two places expressed as a
proportion between the vertical intervals (VI) and horizontal equivalent (HE).
When two places are located at different heights (altitude), the difference in height
between them is known as the vertical rise or the vertical interval (V.I).
The horizontal distance is the distance between the two places represented on a
map which is corresponding with the real distance on the ground.
Gradient is calculated as follows:
• Plot the two points on the map which are needed to determine the gradient.
Name them for instance as A and B or X and Y.
• Join those two points by a straight line.
• Use the scale to measure the distance between A and B (H.E). Let us consider
the distance to be 8 cm.
• Calculate the actual ground distance using the map scale. If the scale of the
map is 1:50,000 meaning that 1 cm on the map represents 50,000 cm on the
ground. Therefore, the ground distance of the represented area would be 8 x
50,000 which 400,000 cm = 4000 m.
• Calculate the difference in height between points A and B, using the contours.
For example, the difference in height between A and B is 200 m.• The formula for calculating the gradient is:
1.3.3. Amplitude
Amplitude refers to the difference between the highest altitude and the lowest
altitude along the cross section.
1.3.4. Intervisibility
Intervisibility refers to whether one point on a map can be seen from another point.
• A point is intervisible when it can be seen from another point, i.e. there is no
higher land between the two points.
• A point is not intervisible when there is higher land or some obstruction that
blocks being able to see one point represented on a map from another point.
• Intervisibility can be established by drawing an intervisibility line between
two points on a cross- section.
• Intervisibility can also be established by looking at the contour heights on a
topographic map between two points to see if there are any higher areas of
land blocking the view between these two points.
• On the cross-sections in Figure 1.6 and 1.7 draw a straight line (an intervisibility
line) between the two points A and B on each sketch.
• In Figure 1.6, the intervisibility line is above the cross- section at all heights.
This means that point A is inter-visible from point B.
• In Figure 1.7, the intervisibility line is below the cross-section in one section.
This means that point A is not intervisible from point B.
When checking for intervisibility on a topographic map, join the two places with a
straight light line using a pencil or place a ruler along a line between the two points.
Check the heights all along this line to see if there is higher land blocking the viewbetween the two points.
Application activity: 1.3Use the figure below to calculate the amplitude of the area indicated
1.4. Drawing sketch maps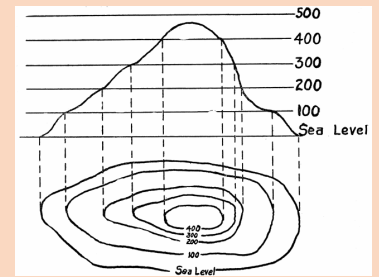
Learning activity 1.4
Move around your school and draw the site of the school compound in your
note book and explain the steps followed in drawing that sketch map.
A sketch map is a simple representation of part or whole of a sheet map drawn on
a piece of paper without using a given scale.
When drawing a sketch map, use the following procedures:
• Identify and critically observe the area to be sketched on the map given.
• Measure the edges of the map.
• Make a frame by either reducing or enlarging the map as instructed.
• Indicate both physical and human features as requested.
• Provide the key for the sketch map.The following are examples of a map and a drawn sketch map of Gituza respectively:
Application activity 1.4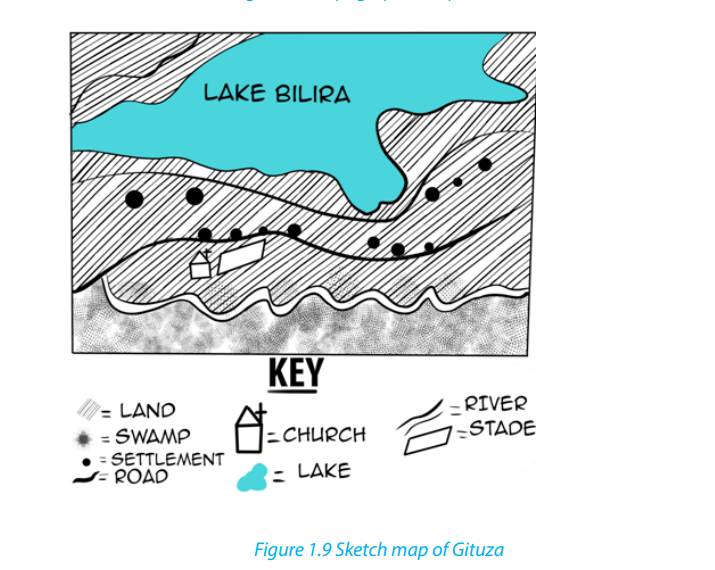
Make a field trip around your school and draw a sketch map of the nearby
market place.
1.5. Enlargement and reduction of a map
Learning activity 1.5
1. Draw a sketch map of your school, identify, mark and name the features
found there.
2. Use the same sketch map drawn in (a) above:
i. To reduce it by 2 times
ii. To enlarge it by 2 times
1.5.1. Map Enlargement
Map enlargement refers to the changing of the size of a given map to a bigger one.
It becomes bigger depending on the number of times it is enlarged. For example, it
may be decided that part of a map is enlarged, and its outline drawn.
The following steps should be followed:
• Identify an area of the original map or part of the map to be enlarged.
• Measure the length and width of the original map or identified part of the
map.
• Multiply the length and width by the number of times the map is to be
enlarged.
• Draw an outline that has new dimensions.
• Mark and label the features in their relative positions.
• The scale also changes (becomes bigger).
1.5.2. Map reduction
Map reduction refers to the changing of the size of the map to a smaller one. Below
are the steps to follow for map reduction:
• Measure the length (L) and width (W) of the given part or whole map. For
example, L=11cm and W=10.8cm.
• Divide the length and width by the number of times the given map is to be
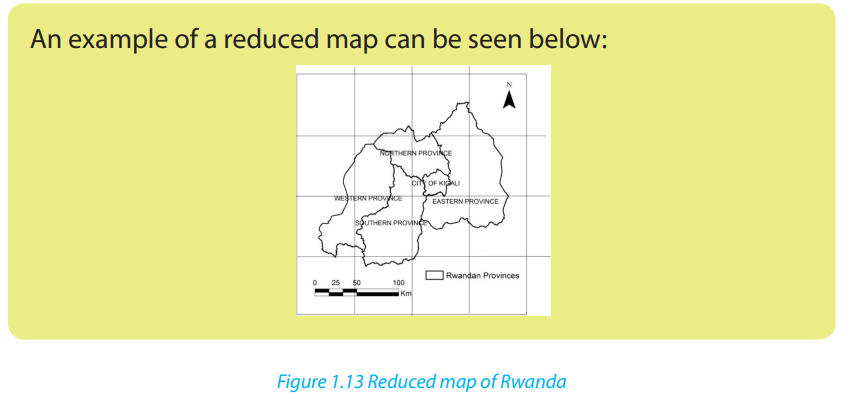
reduced or as directed by the demands of the question. For example, by 2times.
Draw an outline that has the new length and width. For example, L=5.5cm,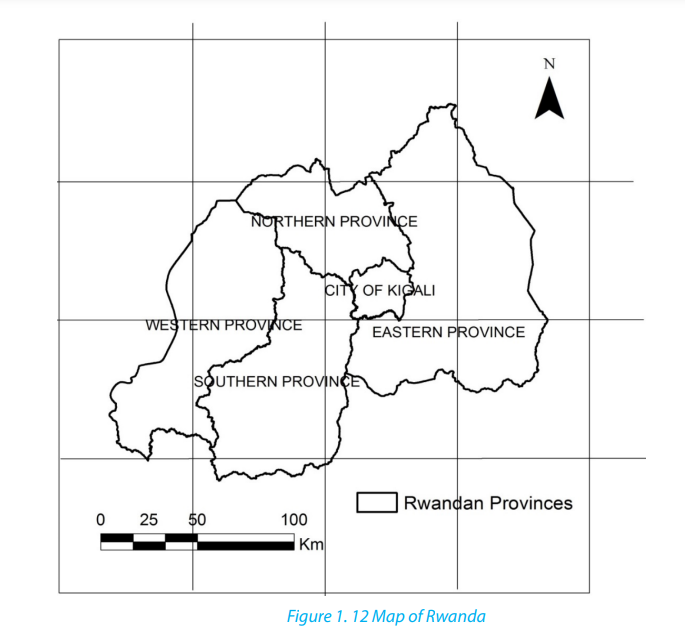
W=5.4cm.
• Mark and label the features in their relative positions.
• Use a key to label features in the map.• The scale changes (becomes smaller).

i. Draw a cross section between point X and Y, make a class presentation.
ii. Enlarge two times the area on the map south of the northings 85 anddraw its outline