Geography and Environment
- S1: Geography TG File Uploaded 16/08/22, 09:52
- S1: Geography SB File Uploaded 16/08/22, 09:56
Unit 2: Elements of a map

By the end of this unit, you must be able to interpret the essential elements of a map and draw sketch maps
Unit objectives
By the end of this unit, you must be able to:
(a) define a map
(b) identify the various elements of a good map
(c) identify and interpret symbols and signs on a map
(d) draw sketch maps
(e) state indicators of relief on a physical map
(f) define a map and an aerial photograph
(g) define an atlas index.What is a map?
A map is a representation of the features of an area of the earth on a flat surface. The area could be on land or sea. A map usually shows physical features such as cities and roads. This representation is usually done on a flat surface or piece of paper.
There are several types of maps. In this topic, we will use topographic maps for our study.
Topographic maps are also called relief maps. These are maps that show both natural and artificial features of a given area. The maps are drawn to scale. This means that they are reduced so that large areas are represented on small sheets of paper.
Read this passage and answer the questions that follow.
Gahigi wanted to go to a place far away from his home. He had been invited by his friend Uwase to go on an expedition. Early one morning, he set out on his journey. His friend had told him that they would meet under a certain tree. She gave him a list of physical features to look out for on his way.
He was to cross a river and then turn right. After going down a valley, he was supposed to turn left and wait for his friend under a big tree with many leaves.
(a) If you were Gahigi, what would you have done?
(b) Do you think Gahigi got to his destination?
(c) Name the tool that Gahigi needed for him to get to his destination quickly.
Study the map of Rwanda below, and answer the questions that follow. Write your answers in your notebooks.
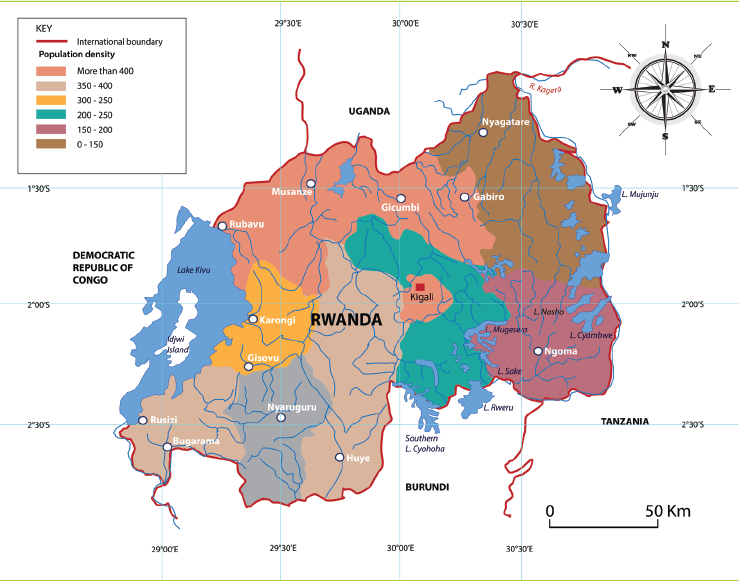
Fig 2.1
1. (a) What is the title of the map?
(b) What is the main information represented by the map?
(c) Why do you think it is important for such a map to have a title?
2. (a) Name other elements of maps that have been shown on the map.
( b) Give the importance of the elements you have identified on the map.(c) Which element helps a map reader to understand the meaning of various symbols and signs used on a map?
3. Suppose Miss Tumusiime wishes to use the above map, which tool would help her to locate Kigali City? .
Elements of a good map
In groups, study the map of Africa below and answer the questions that follow.
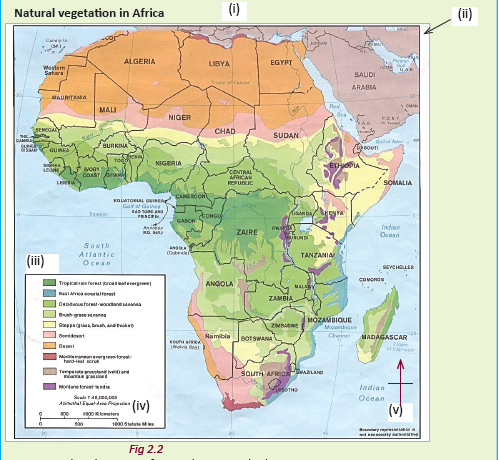
1. Name the elements of a good map marked:
(a) (i), (ii), (iii), (iv) and (v).(b) Explain the purpose of each element mentioned in (a) above.
2. Give the direction of tropical rain forests from Lesotho.
A good map has specific features. These features are commonly referred to as the elements of a map.The elements of a map are not part of the information that is represented in a map. They are therefore usually placed at the margins.
The following are the major elements of a good map.
Table 2.1 Elements of a good map.
Element Description Title This shows the information that is contained in a map. Frame This is a line that surrounds a map showing its limitation. A key This is a tool that is used in maps. It helps a map reader to
understand the symbols, colours and signs used. A key is important
since it helps one to understand the contents of a map in detail.A compass This shows the direction of various features that are shown on
map. The directions are usually in relation to the cardinal points
of a compass. They are North, South, West and East.Scale This is the ratio of the size of a map to the ground area
represented on it. A scale helps cartographers to draw a large
area of the earth’s surface on a small sheet of a paper.
In groups, use the elevation map shown below to answer the questions that follow.Physical features of Rwanda
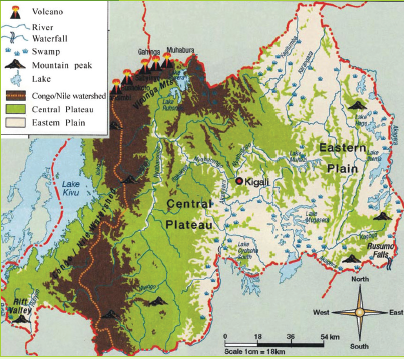
Fig 2.3
1. Which physical feature is found to the north-western part of the map?
2. Name the lake that is found to the western side of the map.
3. Give the direction of Birunga Mountains from the Eastern plains.
4. Your teacher has organised a trip for you to the Rusumo falls. Identify its direction from Kigali city.Symbols and signs used on maps
A symbol is something that is used for or regarded as representing something else.In map work, a key usually shows different symbols.It also gives their meanings. The symbols are usually in the form of shorthand characters, pictorial presentations or colours. In most cases, they show the activities, towns and other physical features. This is done purposely to avoid overcrowding
a map with a lot of information that would make it look untidy.
In groups, use the map extract provided below.
1. Identify the symbols used to represent various features on the map.
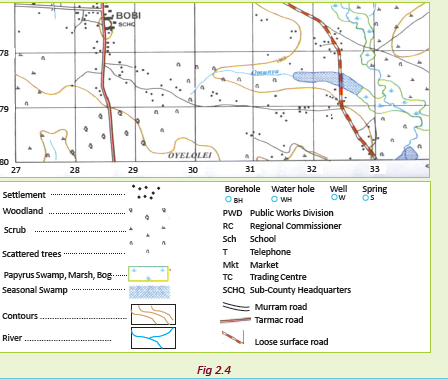
2. Use the map key to identify the symbols used.
3. Give the meaning of each of the symbols and signs used on the map.Some of the features represented on a key are given in Table 2.2:
Table 2.2 Symbols used in maps
Feature Symbol used Road 
Railway line 
Airstrip (airport 
Religious centre
Village 
Town 
Mineral works/mining 
Power transmission line 
Mosque 
Hut 
Bridge 
River 
Lake 
School 
Hospital 
Antiquity 
Swamps 
Telephone lines 
Trigonometrical
station (Primary
Trigonometrical
station (Secondary)
Foot path 
Brown lines (contours) 
The features shown in Table 2.2 are only a few of the features that are represented
on maps. It is important that you go to the library and find out other symbols used to represent the features that are shown in maps. The symbols used on maps are usually given in the key of a map. It is important to study the key of a map.
Drawing sketch maps
Do the following under the guidance of your teacher.
1. Collect drawing materials: pencils,paper, a ruler and an eraser.
2. Go outside your classroom and carefully observe your school surroundings.
3. Draw a map showing your school surroundings. Your teacher will show you how to come up with and use different scales, for example 1:100,000
4. On the map, use symbols to represent features such as buildings, vegetation and roads.
5. Include all the elements of a good map on the map that you draw. This include; a title, a frame, a key, a scale and a compass.
A sketch map is an outline map that is drawn from observation.It does not use exact measurements. It only shows the main features of an area.
Below is an example of a sketch map of Mt. St. Helens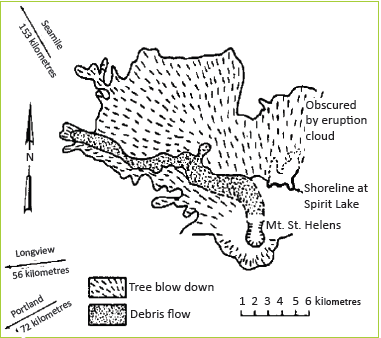
Fig 2.5 Sketch map.
.Characteristics of sketch maps
Sketch maps have the following features that distinguish them from other maps.
• They are drawn roughly.
• They are not drawn to the scale.
• They represent few features for the interests of the user.
• They are less detailed as compared to topographical maps.
• They are simple and hence easy to understand.
• They have the elements of a good map such as the title, key, frame and compass.
Steps involved in drawing a sketch map
There are five steps in the designing and drawing of a sketch map.
1. Identify and point out the features to be represented. For instance,landforms such as hills, mountains,lakes and rivers. Remember to also include land use such as construction,mining and farming. Transport facilities such as roads, railway lines and airports should also be included.
2. Place the identified elements in order according to the divisions of the landscape.
These include the background, middle ground and the fore ground. This is important because it ensures that each feature is rightly shown where it is supposed to be.
3. Draw the actual sketch map,representing it in a simple way.
4. Select a suitable title that accurately shows the purpose of the sketch map,for instance, what the map is about.
Sketch map of a school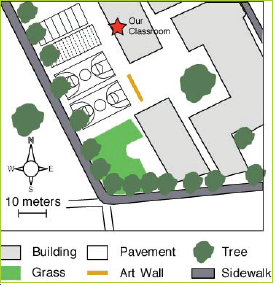
Fig 2.6 (a) Sketch map of a school.
Sketch map of a school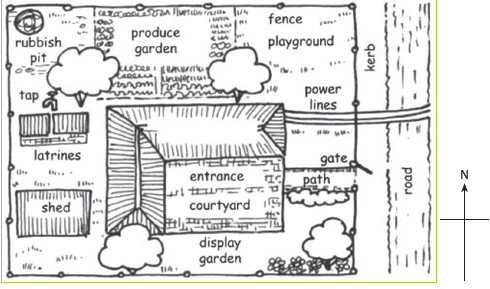
Fig 2.6 (b) Sketch map of a school.
1. Draw a sketch map of your homestead with all the features that are in it.
2. In your sketch map apply the elements of a good map.
3. Use a scale of 1:24000.
4. Present your work for assessment by your teacher.
Task 2.1
1. Explain the meaning of a map.
2. Which of the following combination comprises of elements of a good map?
A. Title, roads, key
B. Title, key, relief
C. Title, key, compass direction
3. Give other elements of a good map that are not listed in the combination in Question 2.
4. State the difference between a topographical map and a sketch map.
5. Explain the main steps involved in drawing a sketch map.
6. Describe the characteristics of a sketch map.
Indicators of relief on maps
In groups, use the map extract provided below to answer the questions that follow: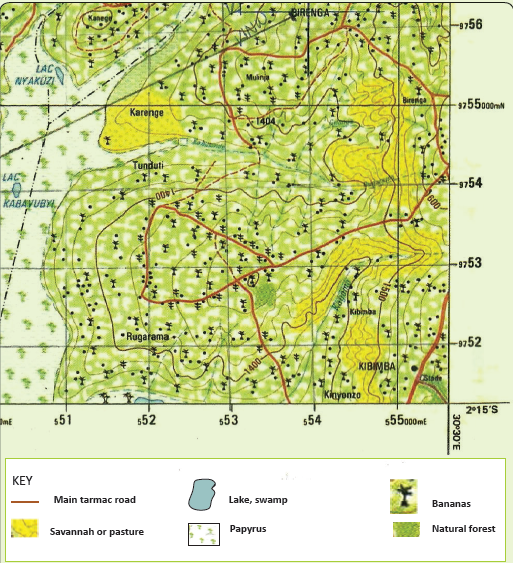
Fig 2.7
(a) Identify the vegetation type of the area represented.
(b) Identify two natural features on the map.
(c) Describe the economic activity of the people in the area.The term relief in geography refers to the nature and outlook of a landscape. Relief usually refers to the highest and lowest elevation points in an area.
Mountains and ridges are the highest elevation points, while valleys are the lowest. Relief describes the horizontal and vertical dimensions of a land surface.This is also known as terrain.
Relief features are visible on physical maps.This is because these maps emphasize the height of the land. This is usually shown with differences in colour and shading. This is done for different heights.The earth’s surface is made up of various relief features. These features have varying altitudes, characteristics and origins that shape their appearance. The relief features represented on maps include the following:
• mountains
• hills
• rivers
• lakes
• plains (low land areas)
• escarpments/rift valley
• fault lines
• swamps.
It is important to study relief in geography because of the following reasons.
• The terrain of an area is one of the main determinants of its suitability for human settlement. Rocky and steep areas are not favourable for human settlement. Flat plains that have alluvial soils are suitable for settlement.
• Understanding an area’s relief helps town planners to understand the drainage of an area.Relief maps help planners to locate watersheds and to determine where water moves. It also helps to predict how human activity is likely to affect water quality over time.
• Knowing the relief of the land also helps with planning for soil conservation. Soil conservation is important in agriculture.This helps to inform the farmers about practices like contour ploughing.• Knowing the terrain of an area makes the difference between a smooth landing and a difficult one, for aircrafts.

Do this in groups with the guidance of your teacher.
1. Go for a field study in the area around your school.
2. Study the relief of the area. Observe both the artificial and natural features.
3. Study the relationship between the artificial and natural features.
4. Write down your observations in a notebook.
5. Explain how human activities have affected the environment.
6. Explain the ways humans can use their surrounding in a sustainable way.
Methods of presenting relief on mapsPhysical maps show the location of landforms like deserts, mountains and plains. Topographical maps are detailed, accurate graphic representations of features that appear on the Earth’s surface. These features include:
• roads, buildings, urban development, railways and airports.
• geographical features, administrative boundaries, state and international borders and reserves
• lakes, rivers, streams, swamps and coastal flats
• mountains, valleys, slopes, depressions and plains
• forested and cleared areas.
A map key lists the features shown on the map, and their symbols. There are many ways of representing relief on topographical maps. They include:(a) use of colour
(b) trigonometric stations
(c) spot heights
(d) contours
(e) pictorials
(f) hachures
(g) shading
Layer tintingThis is the use of colour to show different relief features in relation to various heights.The colour or shade used varies from dark to light shades.
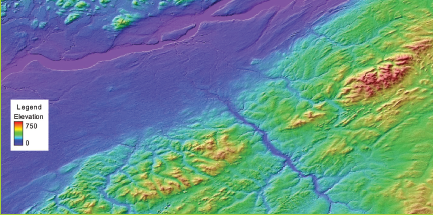
Fig 2.8 Coloured representation of relief.
The dark shades of colour are used for areas of higher altitudes. Areas with lower altitudes
are shaded using lighter shades of colour. For example, areas with ice or snow are shown
in white. Dark brown represents mountains, light green shows low lying areas and light brown colour represents hilly areas. Depths of oceans and seas are shown in shades of blue from light to dark. This means that as the height increases, the shade deepens and becomes darker.
Do this in groups.
1. Study the map of Figure 2.9.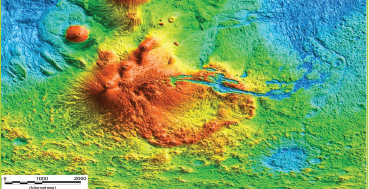
Fig 2.9
2 Identify the relief features shown.
3. Describe the height of the features presented on the map.
4 Present your findings to the rest of the class.Trigonometric stations
These are fixed surveying stations that are used for land surveys. A trigonometric station is also known as a trig point. Many trigonometric stations are located on the top of hills. This is done so that they can top of hills. This is done so that they can easily be spotted from many directions Trigonometric stations are shown on maps using a triangle. In some instances, the
actual heights of specific spots where the triangles are placed are given beside the triangle. The stations are important in the construction of modern infrastructure such as land boundaries, roads, railways and bridges. Table 2.3 shows the types of symbols for trigonometric stations.
Table 2.3 Symbols showing trigonometric stations.

Do this in groups.
Study the map of Figure 2.10.
Fig 2.10
1. Using the map extract provided, state the highest points in metres.
2. Describe the terrain of the area represented on the map.
3. Draw a sketch map of the landscape around your school. Use colour to show the
important features.Spot heights
These are dots used to represent specific areas on a topographical map. They show the
actual heights of given areas. For example, • 2015 • 2001 • 560 • 675.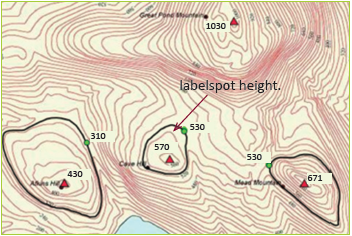
Fig 2.11 Spot heights on an extract of a topographical map.

Do this in groups of three.
1. Identify the spot heights indicated on the map of Figure 2.12.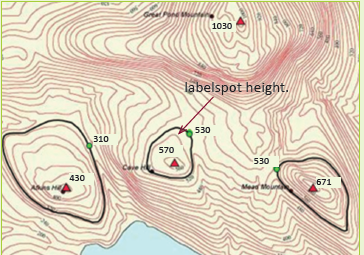
Fig 2.12
2. Describe what they represent.
Contours
Contours are lines drawn on maps joining areas with the same height above sea level.
They show both the height and steepness of a place. Height is usually represented in metres or feet. The contour lines are usually drawn at intervals called contour intervals. The contour lines never cross each other. The lines are usually brown in colour. In steep areas, the lines are very close to each other. In areas with gentle gradients, the lines are far apart. Contours are mostly used in representing relief on topographical maps.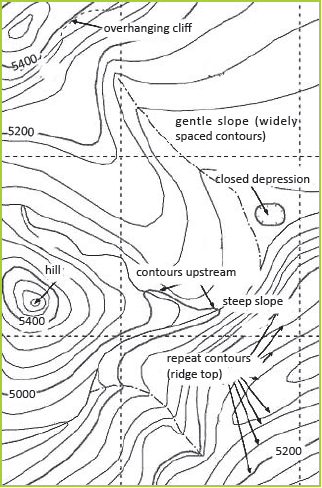
Fig 2.13 Contour lines used on a map.Characteristics of contour lines used on maps
• They have the height number written on them.
• They are drawn based on a specific and uniform interval.
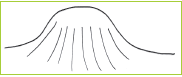
In pairs, do the following with the guidance of your teacher.
1. Study the picture below.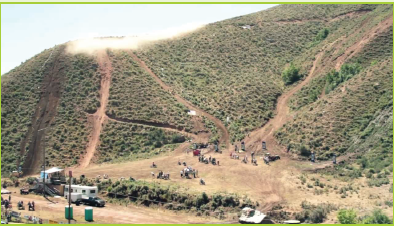
Fig 2.14
2. Which side of the hill is shown in Figure 2.14?
3. Sketch contour lines representing this side of the hill.
4. Give reasons for your choice of sketch.Interpretation of contours on a topographical map
various landforms. Some of the landforms
include:
• conical hills
• flat-topped hills
• ridges
• hills with depressions
• craters
• slopes
• plateaus• spurs
• low lands
• river valleys.Conical hills
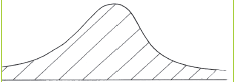
Fig 2.15 A conical hill .
tops with slopes that are similar in gradient and appearance. The contours representing conical hills are of the same size. They also have uniform spacing between them. This means that the lines are evenly spread.They usually have a circular arrangement as shown in Figure 2.16.
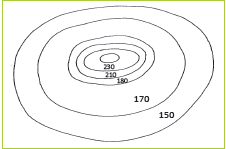
Fig 2.16 Contour lines representing a conical hill.
The top part of the hill is represented by contour lines which are close together. As you move away from the top, the space between the lines are widely spaced on the slopes of the hill. This is due to the gentle gradient of the slopes. If a hill has the same gradient in all its slopes, it is represented by the contour lines shown in Figure 2.17.
Fig 2.17 Contour lines representing a conical hill with an even gradient
Flat-topped hillsThese differ from the conical hills as their tops are generally flat. The contour lines representing flat-topped hills are wide apart at the top, but start getting close together towards the lower parts of the hills.

Fig 2.18 Flat topped hill.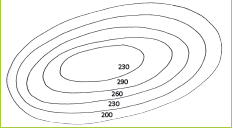
Fig 2.19 Contours representing a flat topped hill.
Hills with depressionsThese are hills which have depressions at their tops. They are represented by contours that are ring shaped. The depression is represented by pictorial symbols.
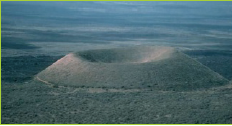
Fig 2.20 A hill with a depression on its top.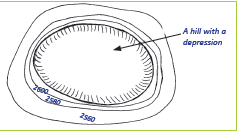
Fig 2.21 Contours representing a hill with a depression.Depression craters

Work in groups of three. Use geographical documents and other resources.
1. Find out information about
(a) depression craters
(b) ridges
(c) escarpments.
2. Write short notes about each feature.
3. Present your findings in a class discussion.
Depression craters are hills or mountains that have deep depressions usually containing water. An example is Mt. Bisoke in Rwanda. Such hills or mountains are represented on a topographical map with ring-shaped contour lines.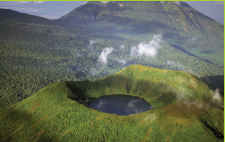
Fig 2.22 The crater lake on Mt. Bisoke
Fig 2.23 Contours representing a depression crater
RidgesA ridge is an elongated or stretched out hill,or a range of hills that are close together. The contour lines representing ridges are elongated or sometimes oval shaped. In some instances, the hills that make up a ridge are separated from each other by gaps called saddles which are broad gaps or cols which are narrow gaps.
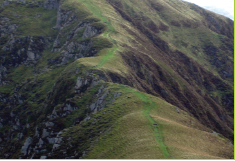
Fig 2. 24 A ridge.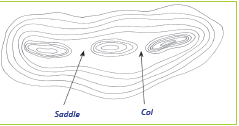
Fig 2.25 Contours showing a ridge with cols and saddles.
EscarpmentsThese are physical features that have two distinctively different slopes. One side is steeper than the other. The steep side is called a scarp slope while the gentle side is known as the dip slope. The contour lines representing the dip slope are far apart from each other while those representing the scarp slope tend to be close together.
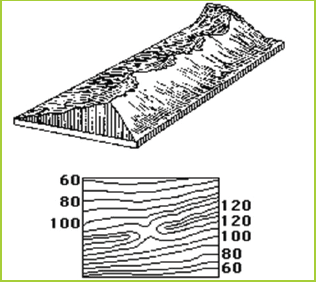
Fig 2.26 An escarpment and contour lines representing it.
Your teacher will take you to a hill near your school. Do this in groups.
1. Observe and describe the nature of the hill.
2. Identify the scarp slope and the dip slope.
SlopesA slope refers to the surface of the earth whereby one end is at a higher level than the other.
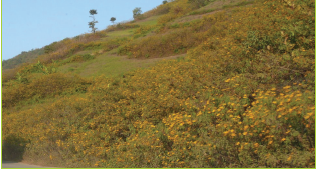
Fig 2.27 A slope.
.Types of slopes and how they are represented on topographical maps

1. Your teacher will take you for a field visit to an area near your school.
2. Carefully study the hilly areas and the slopes and draw them in your exercise book.
3. Describe the difference in the gradients of the slopes you have drawn.
Concave slope
The contours that represent this slope are close together towards the top. They are
wide apart towards the base of the slope.This is because the land is steep at the top
and gently slopes towards the base.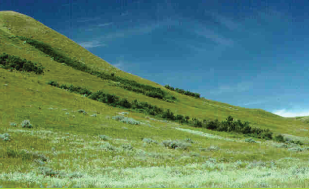
Fig 2.28 (a) A concave slope.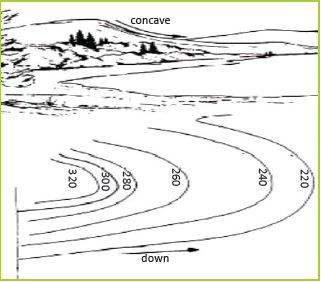
Fig 2.28 (b) Contours representing a concave slopeConvex slopes
This is a slope that is gentle towards the top and steep towards the base. The contours are widely spaced at the top. Towards the base where the land is steep, they are closely spaced.

Fig 2.29 (a) A convex slope.
Fig 2.29 (b) Contours representing a convex slope.
Steep slopes
Do this is in groups of three. Use Figure 2.30 below to answer the questions that follow.
. Fig 2.30
1. Describe the nature of the landscape shown.
2. Explain the gradient or nature of the slope.
3. Suppose you lived in such an area, how would you use the land sustainably?
A steep slope is represented on a topographical map by contours that are very close together. This is due to the uniform steepness of the slopes or land.
.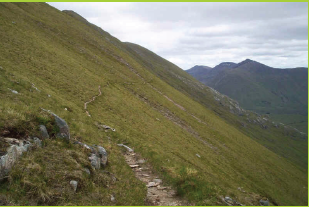
Fig 2.31 (a) A steep slope
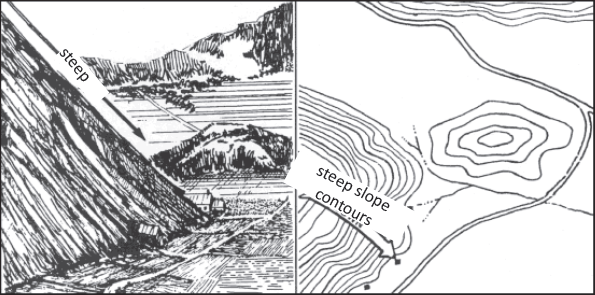
Fig 2.31 (b) Contours representing a steep slope.
Gentle slopes
A gentle slope is represented on a topographical map by contours that are uniformly spaced. This is because the slope is uniformly gentle.

Fig 2.32 (a) A gentle slope.
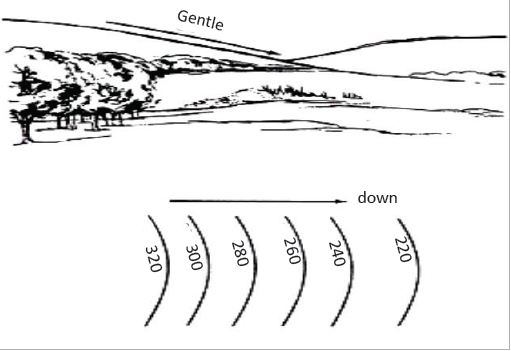
Fig 2.32 (b) Contours representing a gentle slope.
Flat land or plainsThis is represented on a topographical map by contours that are uniformly widely spaced. Such areas are associated with other features such as swamps.

Fig 2.33 (a) A flat land
Fig 2.33 (b) Contour lines on a relatively flat land.
Even slopeThis is a slope where the land has an almost similar gradient. When being represented on a topographical map, contour lines with same distance between the lines are drawn. Thecontour lines are equally spaced.

Fig 2.34 (a) An even slope.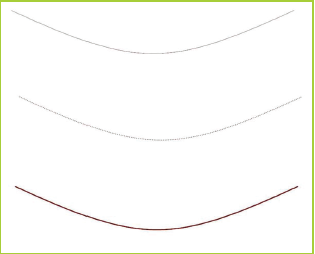
Fig 2.34 (b) Contours showing an even slope.
Work in groups.
Do the following.
1. Describe the nature of the land shown by the contour lines.
2. Identify some of the landforms on the map represented by the contour lines.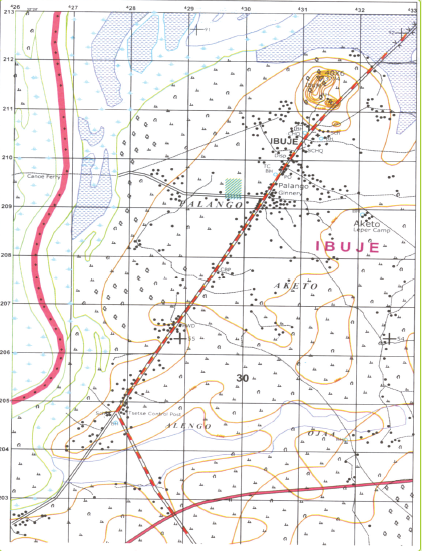

There are other indicators of relief used on maps. They include the following.
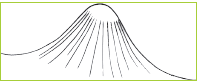
Hachures
Hachuring is one of the commonly used methods of representing relief on topographical maps. This method is used to show the altitude of a given area. It is used
more in places with steep gradients. They are represented using short parallel lines.The steepness or gentleness of a slope is shown using lines with varying lengths and thicknesses. It is very important to note that hachures do not reveal the actual heights of areas represented as is the case with contour lines.
Fig 2.36 Hachures.
Table 2.4: Interpretation of hachure lines.
Nature of the lines interpretation Lines drawn very close to one another in a compacted way.
Represent a very steep slope or gradient
such as a cone volcano.
Lines drawn widely apart and less compacted or not congested (thin in nature).
Represent a very gentle gradient or a
gently sloping area.
Pictorial method
This method uses symbols based on the appearance of the features. It shows how features appear from above. For example, mountains are raised while valleys are sunken. When showing height, very short thick lines which have thick heads and tails are used. The sharp point of the symbol points towards the lowland part of a feature while the thick head points to the
high altitude.
Hill shading
This method of representing relief is about careful use of light and shadow. It is imagined that light over a given area brings variations in shading. The intensity of light keeps on reducing depending on the nature and angle of the slope and the gradient. The darker expressions are used to represent the steep slopes. Bright expressions are used to represent hill tops, areas with gentle gradients such as valley bottoms and plain or flat lands.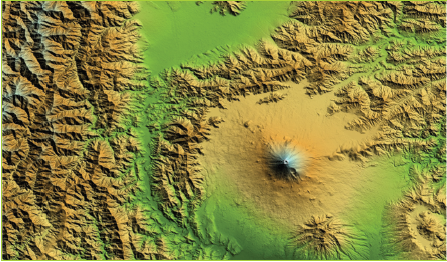
Fig 2.37 Hill shading.
Do this in groups. Study the map extract provided below, and answer the questions that follow.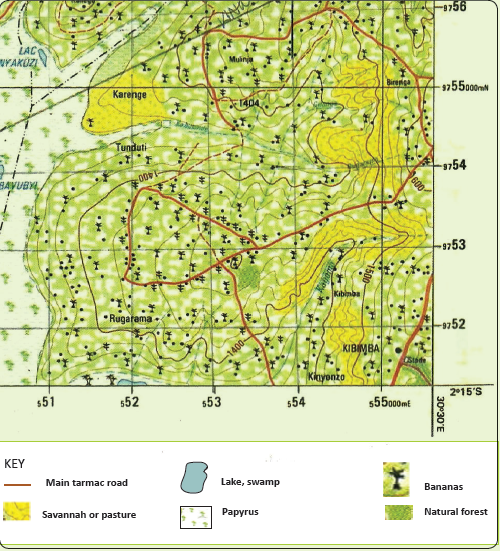
Fig 2.38
1. Give the grid reference of Lac Nyakuzi.
2. Mention the relief indicators that have been used to represent relief features on the map.
Do the following in groups, with the help of your teacher.
1. Draw a sketch map showing the landscape of the area around your school.
2. Using different colours, shade the map illustrating variations in light. Ensure that you bring out the gradient expressions.
3. Present your drawings to the rest of the class for discussion.
Maps and aerial photographs
1. Study Figures 2.39 and 2.40. Give a name to each one of them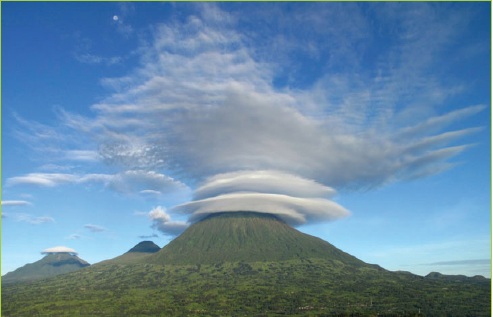
Fig 2.39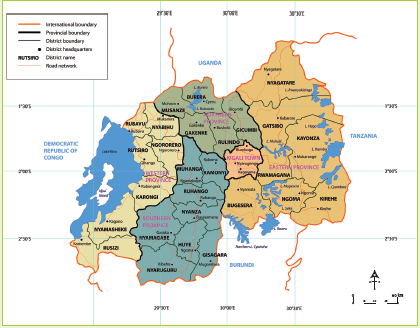
Fig 2.40
2. Describe the features of each one of them.
As earlier explained, a map is a representation on a flat surface of a whole or part of an area. Maps represent parts of the earth’s surface drawn to scale. Figure 2.41 shows a map of Rwanda
Fig 2.41 A map showing the districts of Rwanda
A photograph is a picture created using a camera and stored digitally. Photographs are usually in the form of a print or a slide. A photograph could be a picture of a person,a scene or a physical feature on earth or space.The sizes of photographs vary. There is
no relationship between the size of a photograph and the size of the object represented.
An aerial photograph is a picture of the earth’s surface taken from above. The picture is usually taken from an aircraft. Aerial photographs are often used as data for geographers. They are also used for locating geographic features as well as for interpreting environmental conditions.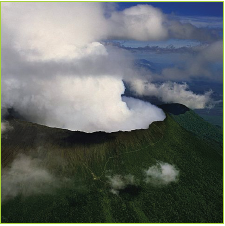
Fig 2.40 An aerial photograph of Mt. Bisoke in Rwanda
Your teacher will provide you with copies of maps and a variety of aerial photographs.
1. Study the documents carefully
2. Identify maps and photographs. Do this by separating them accordingly.
3. Give reasons why you have classified them the way you have.
4 Present your work to the rest of the class members.
Differences between maps and aerial photographs
Aerial photographs and maps are used by geographers. Cartographers sometimes
use aerial photographs when designing and preparing maps.
Under the guidance of your teacher, do the following.
1. Draw a sketch map of your school. Include all the elements of a good map in your drawing.
2. Your teacher will help you take ground photographs of your school using a camera.
3. Compare the photographs you have taken with the aerial photographs that you had studied before.
4. Note the differences that you can observe between the two types of photographs. Write them in your exercise books.
5. Note down the differences between the aerial photographs and the map that you have drawn.
6. Present your findings in class.
The table below shows the difference between maps and aerial photographs.
Table 2.4 Differences between maps and aerial photographs.
Maps Aerial photographs A map is a representation of a part of the earth’s surface. An aerial photograph is a picture taken from a raised platform representing a small part of the earth’s surface They are drawn to scale. Not taken to scale. A map can represent a relatively large area. An aerial photograph only covers a small area or object. The features used on a map are
interpreted by use of symbols.The features are clearly seen without the use of symbols. They appear as they are in their natural form. A map is sometimes difficult to
interpret.An aerial photograph is easy to interpret. A map only shows specific information that is needed. It is thus prepared
selectively.An aerial photograph shows all features that are near a place, whether they are useful or not. A map is difficult to come up with. It
requires a wide range of skills such as
cartographic techniques.It is relatively easier to take a photograph. It only requires one to have a camera and to know how to use it. A map has a key that helps readers to
interpret and understand it.An aerial photograph has no key. To understand it, one only has to keenly look at it. A map has no skyline. It does not show the horizon which can be used to determine the relief of an area. It instead uses contours to represent relief. An aerial photograph has a skyline especially the high oblique aerial photographs. This makes it easy to determine the relief and climate of the
area represented.A map has a compass that shows the direction of various parts on it. This is done in relation to the actual areas being represented. An aerial photograph does not have a compass
to aid in determining the direction of the features in it.
Atlas index
Work in groups. Your teacher will give you atlases.
1. Read the contents on the last page of the atlas.
2. Write down your observations in your exercise book.
3. Using the Internet and your textbook, find out the meaning of an atlas index.
4. Identify its main characteristics.
5. Write down the findings in your exercise books for class presentation.An atlas is a collection of maps of the Earth or regions of the Earth. However, there are atlases of other planets too. An atlas is usually a bound book with a collection of maps. However, there are atlases in multimedia formats
Fig 2.43 An atlas book
Atlases usually present geographical features, political boundaries, geopolitical, social, religious and economic statistics. They also have information about maps and places in them.
An atlas index is a detailed alphabetical listing of names, places and topics. In some cases, an atlas index follows numerical listing. The list is accompanied by the numbers of the pages on which they are mentioned or discussed. The atlas index is usually found at the end of the atlas.
1. Your teacher will provide you with an atlas. Find the index page and comment on the following.
• Content of the index.
• The position of the index.
• The arrangement of content of the index.
2. Present your findings in class.
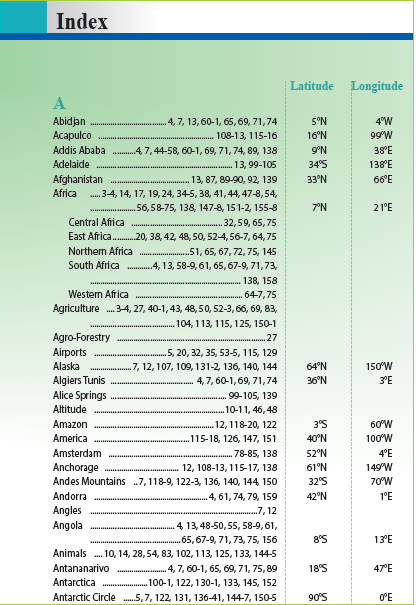
Fig 2.44 Sample of an open atlas index.
Elements of an atlas index
The atlas index shows various topicsband names of places.
The index is at the last pages of the atlas.
The index lists a summary of the specific contents of the atlas.
The index acts as a pointer. It directs the reader to specific pages where given topics can be found inside the atlas.
The index follows a systematic alphabetical or numerical order.The following are the elements of an atlas index.Did you know?
• No one knows the exact date when the first map was created.
• People who create maps are known as cartographers.
• Some of the first detailed maps were made by armies.
• It is impossible to create a map with a perfect scale.
• The first aerial photographs were taken by French map makers in 1858.
1. (a) Define the term relief.
(b) Name six the features that are represented on a topographical map.2. (a) Name the seven different ways that can be used to represent relief on topographical maps.
(b) Muhire wants to indicate the height of a specific spot of an area on a map. Suggest to him two methods that he can use.
3. (a) Distinguish between an trigonometric station and a spot height.
(b) Name two types of trigonometric stations.
(c) Show the symbols used for each.
4. (a) Explain the difference between hachures and hill shading methods of representing relief.
(b) Give the appropriate illustration for each.
5. (a) Define contours.
(b) Explain the main characteristics of contours in map work.
(c) Describe types of slopes and explain how they are represented on topographical maps.
6. Using illustrations, explain how the layer tinting method can help geographers to represent relief on a map.
7. Explain five differences between a map and an aerial photograph.
8. (a) Give the meaning of an atlas index.
(b) Describe the characteristics of an atlas index.