Topic outline
UNIT 1: COMPUTER SECURITY
Introductory activity
Jane is an accountant in charge of payroll preparation in the Ministry of
Finance of Rwanda. She has a computer which, two months ago was
working quickly and properly. Every day she uses internet connection for
operating some online transactions, she also used a flash disk to share
her work with different workmates. Today her computer is no longer
responding quickly as before, when connecting a flash disk on her
computer some data are lost others hidden, some data are duplicated,
disorganized and most of the time her computer restarts itself while sheis working.
Discuss the main different causes of the above-mentioned issues of Jane's computer
identify the risks of an unsecured computer
Describe how this computer can be secured
Describe how data stored in a computer can be protectedActivity 1.1
What do you understand by security of the computer?
1. How a computer user can protect data and information stored in that computer?
2. What will happen if a user leaves his/her computer without switching it off?
1.1.1 Computer security
Computer security means techniques developed to safeguard information stored
on a computer. It is also the protection of computer systems and information
from harm, theft, and unauthorized use. The standard for a good security tells us
that 10% of security safeguards are technical, 90% of security safeguards rely
on the computer user to adhere to good computing practices.
Computer security is everyone’s responsibility; this means that everyone who
uses a computer or mobile device needs to understand how to keep their
computers, devices and data secure.
1.1.2. Computer security related terms
Security: This is a state of feeling safe and protected. Something that provides
a sense of protection against attack, harm or loss is security.
Malware: It is a file or code, typically delivered over a network, that infects,
explores, steals or conducts virtually any behavior an attacker wants. And
because malware comes in so many variants, there are numerous methods to
infect computer systems.
Spyware: Spyware is software with malicious behavior that aims to gather
information about a person or organization and send it to another entity in a
way that harms the user. It installs itself on your computer and starts covertly
monitoring your online behavior without your permission.
Trojan horse : A trojan horse, is a type of malware that conceals its true content
to fool a user into thinking it’s a harmless file.
Worm: A computer worm is a program containing malicious code that attacks
host computers and spreads via a network. Network worms exploit security
vulnerabilities in various applications. Due to the availability of the internet, they
can spread all over the world within a few hours of their release.
Adware : Adware (or advertising software) is the term used for various pop-up
advertisements that show up on your computer or mobile device. Adware have
the potential to become malicious and harm your device by slowing it down,
hijacking your browser and installing viruses and spyware.
Authentication: This is a process used to identify individuals based on
username and password. This process establishes whether; Someone or
something is in fact who or what is declared to be. Authentication ensures that
the individual is who he or she claims to be but nothing about access rights ofan individual.
Authorisation: This is permission to perform action.
Username: A username is a name that uniquely identifies someone on a
computer system. For example, a computer may be setup with multiple accounts,
with different usernames for each account.
Password: A Password is a word, phrase, or string of characters intended
to differentiate an authorized user or process (for the purpose of permitting
access) from an unauthorized user. A password is used to prove one’s identity,or authorize access to a resource.
Username is almost always paired with a password. This username/password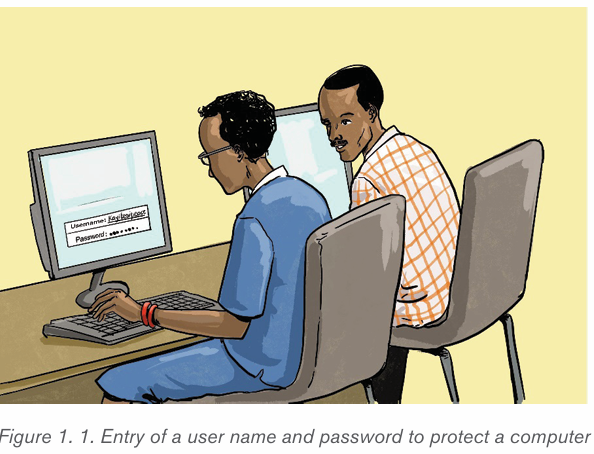
combination is referred to as a login, and is often required for users to log in
to computer or websites. For example, to access the e-mail via the Web, it is
required to enter the username and password. Once, it is done the usernamemay appear on the screen but the password is kept secret.
Application activity 1.1
1. Explain the meaning of the term Computer security.
2. Identify consequences of security violation
3. What is the role of applying password and username to login to a page?
1.2 Importance of computer security
Activity 1.2
The school accountant, wanted to make a payroll, but was unable to find
the final updated list of school employees on his/her computer. He/she
remembered that some days ago, she/he gave the same computer to the
school secretary to write a letter.
The school accountant decided to use any list found on his/her computer.
1. Discuss the impacts that may arise when the School Accountant
uses any list found on his/her computer
2. In pairs, discuss what can be the solution for the next time for not
losing either the letters or the list
3. Apart from the School Accountant and Secretary, who else has the
responsibility to protect the computer? Support your answer withpositive impacts of protecting a computer in different ways
The importance of computer security is to protect the computer and its data as
well as its user’s identity. The data and information that most users store on their
hard drives are often far more valuable than the computers themselves. Broadly,
the importance of computer security lies in how harmful it can be if that data islost.
Companies often store a lot of very sensitive information electronically, including
trade secrets, customer lists and extensive corporate documents, both finished
and those in progress. The importance of computer security is obvious in these
contexts. It is perhaps less obvious for home computer users, but it is no lessessential.
When computer hackers gain access to a computer, they can often see
everything that is stored there. This might include bank information, tax
identification documents and sensitive health information, along with
more ordinary files such as Word Processing documents and family
photos. Cyber criminals can use personally identifiable information to stealidentities and perpetrate fraud.
The importance of computer security also extends to larger network security.
A compromised computer can be manipulated and made into an agent of a
cyber crime ring. As one example viruses and malware are often designed tohijack and exploit email address books. They can sometimes also turn home
computers into bots, which are computers that have been taken over and are
made to network with others all over the world to perpetrate crime. Computers
that have fallen victim to bot networks are not fully used by their owners, often
they run very slowly and constantly their memory space is diverted to runningmalicious scripts.
Security of computer should help protect the confidential and important data
stored on a hard disk storage.
The major importance of computer security is:
Protect the computer
Protect data
Protect user’s identification.
This is mainly because data present in the computer can be misused by
unauthorised intrusions.
• Purpose of computer security is to:
• Keep your information on computer protected
• Maintain your computer’s overall health
• Help prevent viruses and malware
• Help programs run more smoothlyGenerally, computer security helps keep information safe
Application activity 1.2
1. Give the major importance of computer security
2. Discuss different kinds of data to be protected.
3. Discuss and write a brief report on the importance of computersecurity at your school, in financial institutions and in education field.
1.3 Computer threats
Activity 1.3
A consultant in the finance field joined her office as usual in the morning, after
switching on her computer, she realized that it goes slowly, some data on the
hard disk were unavailable, and faced complications of saving document on
the hard disk, yet the computer was before operating properly for long time ago.
– Describe the reasons of the above issues and propose what could bethe solution.
1.3.1 Threats
A threat, in the context of computer security, refers to anything that has the
potential to cause serious harm to a computer system. A threat is an activity,
attack, situation that may happen, with the potential to cause serious damage.Threats can lead to attacks on computer systems, networks and more.
1.3.2 Threat categories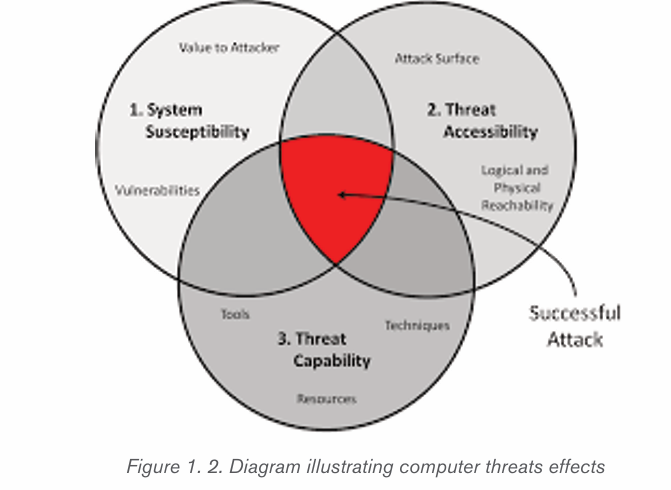
Knowing how to identify computer security threats is the first step in protecting
a computer. The threats could be intentional, accidental or caused by natural
disasters. Computer threats can be physical or logical.
• Physical threats
• Logical threats.
a) Physical threats
Digital storage media and hardware are subject to numerous internal and
external forces that can damage or destroy their readability. Below are some
cases of physical threats :
• Improper storage environment with high temperature, humidity, light, dust
• Over use mainly for physical contact media,
• Natural disaster such as fire, flood, earthquake
• Inadequate hardware maintenance,
• Hardware malfunction
b) Logical threats
Logical threats are events or attacks that remove, corrupt, deny access, allow
access, or steal information from a computer without physical presence of
somebody. These include viruses, worms, trojans, spyware, adware, SQLinjection etc.
1.3.3. Difference between logical threat and physical threats
Physical threats may include theft, vandalism and environmental damage
while logical threats are those that may damage your software systems, data, or
network without damaging your hardware.
General threats to information systems can cause the following:
Hardware failure: A malfunction within the electronic circuits or
electromechanical components (disks, tapes) of a computer system. Example:
a CPU socket damaged.
Software failure : The inability of a program to continue processing due to
erroneous logic. Example: A crash of a computer program.
Electrical problems: Are faults caused by electricity like a low-resistance
connection between two points in an electric circuit through which the current
tends to flow rather than along the intended path.
User errors: Is an error made by the human user of a computer system in
interacting with it. Example: A system file deleted unintentionally by a user.
Program changes ; modifications made to program. Example: a simple
modification in a program can affect the whole software.
Theft of data, software, services and equipment. When a physical or
logical component of a system is stolen, the whole system stops. Example:A computer cannot run without a RAM or cannot run with corrupted software.
Application activity 1.3
1. Discuss the difference between logical and physical threats
2. In the school computer lab, take one computer and remove all
available RAMs in the computer. Discuss what happens to the
functioning of the system.
3. Conduct a diagnostic of the school computer lab. From the diagnosis
enumerate the different threats found in the computers.4. Discuss the effect of both logical threats and physical threats
1.4 Computer virus
Activity 1.4
n the school computer lab, when one student inserted a flash disk in one
computer, all files are immediately deleted and the flash disk becomes
empty. Another student discovers that when he/she opens a document in
my Ms Word, the content is displayed in unknown characters.
In groups, discuss what should be the causes for such problems.
1.4.1 Definition
Computer viruses are unwanted software programs or pieces of code that
interfere with the functioning of the computer. They spread through contaminated
files, data, and insecure networks. Once it enters your system, it can replicate
to produce copies of itself to spread from one program to another program and
from one infected computer to another computer. Viruses are self-replicating
computer programs that interfere with the functioning of the computer byinfecting files, data, programs, etc.
1.4.2 Types of Computer Virus
1. Overwrite Virus
It is the simplest computer virus that overwrites the code of the host computer
system’s file with its own malicious code. The content of the infected file is
replaced partially or completely without changing the size of the file. Thus, it
destroys the original program code by overwriting it with its defective code. The
infected files must be deleted or replaced with a new copy as this virus cannotbe removed or disinfected.
2. Append Virus
As the name suggests, this virus appends its malicious code to the end of the
host program’s file. After that, it alters the file’s header in a way that the file’s
header is redirected to the start of the malicious code of the append virus. Thus,
this code is executed each time the program runs. However, it does not destroy
the host program; rather, it modifies it in a way that it holds the virus code andenables the code to run itself.
3. Macro Virus
Macro virus alters or infects the macros of a document or data file. It is embedded
as a macro in a document and adds its codes to the macros of the document.
The virus spreads when infected documents or data files are opened in othercomputers.
It also spreads through software programs, which execute macros such as Ms
Word, Ms Excel. Each time a document is opened using these programs, otherrelated documents will also get infected.
4. Boot Virus
The first macro virus, which was named concept, spread through emails with
attached Ms Word documents. It infected MsWord 6.0 and Ms Word 95
documents, which were saved using Save as option. Fortunately, it did notcause any harm, except for displaying a message on the screen.
Boot virus or boot sector virus alters the boot sector program stored in the
hard disk or any other storage device such as floppy disks. It replaces the boot
sector program with its own malicious version. It infects the computer only when
it is used to boot up the computer. If it enters after the boot-up process, it will
not infect the computer. For example, if someone forgets to remove the infected
floppy disk when the computer is turned off and then turns on this computer, itruns the infected boot sector program during the booting process.
Usually, it enters into the system through corrupt media files, infected storage
devices, and insecure computer networks. The spread of this virus is very rare
these days due to the decline in the use of floppy disk and use of boot-sectorsafeguards in the present-day operating systems.
5. Resident Virus
The resident virus stays permanently in the primary memory (RAM) of the
computer. When the computer is turning on, this type of virus becomes activeand corrupts the files and programs running on the computer.
6. Multipartite Virus
Multipartite virus spreads and infects in multiple ways. It infects both the boot
sector and the executable files stored on the hard drive simultaneously. When
the computer is turning on, the boot sector virus is triggered as it latches on
to the hard drive, which has the data for starting up the computer. Once it istriggered, the program files also get infected.
7. File Infector Virus
It is one of the commonly found computer viruses. It mainly infects the executable
files; the files with .com or .exe extensions. The virus becomes active when the
infected file is executed. The active virus overwrites the file partially or completely.Thus it may destroy the original file partially or completely.
8. Computer Worm
Computer worm is similar to a virus but is technically different from the virus. It
can replicate and spread like a virus, but unlike viruses, it does not need a host
program to spread. Being able to self-replicate it can produce multiple copies
of itself. It spreads through networks such as an email sent to an infected emailid can infect your system with a computer worm.
9. Trojan Horse
Trojan horse is a malware like a virus or a worm, but it is technically different from
both. It can’t replicate like virus and worm. Trojan horse hides itself in a program.
Once you install any such program, the trojan horse enters into your computer.
It can provide unauthorized access to a computer, send files to other computersand may delete files or can make other unwanted changes in a computer.
10. Cavity virus
It is also known as a spacefiller virus. As the name suggests, this virus tends to
install itself by occupying the empty sections of a file. It is not easy to detect thisvirus as it fills the empty spaces without changing the size of the file.
11. CMOS Virus
It infects the CMOS, which stands for complementary metal-oxide semiconductor
and is a memory chip that contains the system configuration. This virus canerase or reset the system configuration.
12. Companion Virus
It resides itself in a file whose name is similar to another program file, which is
executed normally. When the program file is executed, the virus gets activated
and performs malicious steps such as deleting the files on a computer harddrive. Globe virus is a first known companion virus, which was found in 1992.
13. Encrypted Virus
It encrypts its payload to make its detection more difficult. It comprises two
parts: An encrypted virus body and a decryptor, which decrypts the virus when
it is executed. After decryption, the virus can execute itself in order to replicate
and become a resident. Furthermore, it is different from cryptolocker, which is acomputer virus that encrypts the hard drive data and holds it for ransom.
14. Executable Virus
It is a non-resident computer virus, which resides in an executable file. Wheneverthe infected file is executed, it infects the other files.
15. Polymorphic Virus
It creates its thousands of copies itself; in each copy, it changes the sequence
and byte values to evade detection by antivirus software. Even the best
antiviruses may not be able to detect this virus. Polymorphic viruses affect data
types and functions and generally spread through spam, infected sites, andwhile using other malware.
16. Rabbit Virus
It is also known as wabbit, a fork bomb. It is capable of creating new processes,
and each of the new process further creates new processes. This process
continues until this virus utilizes all the available resources in the system and
system falls short of resources. It may cause the target system to slow down and
crash. For example, it is like an infinite loop that repeatedly creates processesthat consume lots of CPU cycles and operating system resources.
17. Stealth Virus
It is a hidden computer virus, which specifically attacks operating system
processes. It usually hides itself in partitions, files or boot sectors and is capable
of going unnoticed during antivirus or anti-malware scans making it capable ofintentionally avoiding detection.
18. Web Scripting Virus
The web scripting virus is a kind of computer security vulnerability through
websites which breaks our web browser security. This virus allows the attackers
to inject client-side scripting into the web page. It can steal our information from
the web browser. This type of viruses is usually used to attack the sites with alarger population such as social networking, e-mail, etc.
1.4.3 Characteristics of a Virus
Following are a couple of characteristics of any virus that infects computers.
• They reside in a computer’s memory and activate themselves while the
program that is attached starts running. For example: They attach
themselves to the explorer.exe in windows OS because it is the
process that is running all the time.
• They modify themselves after the infection phase making it so hard for
an antivirus to detect them.
• They always try to hide themselves in the operating systems by
encrypting themselves into cryptic symbols and decrypting themselves
when they replicate or execute.
1.4.4 Symptoms of a Computer Virus
There are many warning signs or symptoms which show that a computer is
infected with a virus, some of which are as follows:
• Slow computer performance: The computer may work slowly. The
result for this is that it will take more time to open or shut down, to open
a file, a document or a computer application, etc. The operating system
and internet speed may also slow down.
• Frequent pop-ups: A virus may cause unusual frequent window pop-ups.
• Hard drive issue: The hard drive may exhibit unusual high activity
even when it is not in use. It may cause unwanted changes to the hard
drive and may freeze or crash this device.
• Frequent crashes : One may experience frequent sudden system
crashes while playing games, watching videos, or doing some other
work using the infected system. A blue screen appears when it crashes.
• Unknown programs: Unwanted programs may open or start
automatically when the computer is turning on. These programs are
found in computer’s list of active applications. Sometimes, the window
shuts down unexpectedly without any reason.
• Unusual activities: The computer may perform differently, such as
not being able to log into accounts. The hardware, software, or OS may
start malfunctioning leading to crashing the system abruptly.
• Network issue : Sometimes, there is a high network activity even if the
computer is not connected to the internet and vice versa.
• Unnecessary advertisement: It is normal that sometimes
advertisements may come to the computer screen while browsing, but
when it comes when not browsing, it may indicates a virus on that
computer.
• Affected applications : Some viruses are developed to affect
specific applications. Consequently, some applications may not work if
the computer is infected.
• Blocked by antivirus sites: An antivirus site may deny access to a
computer that is infected by a virus.
• Dialog boxes : Many dialog boxes keep appearing suddenly on a
computer screen.
• Printer issues : A printer attached to an infected computer may print
documents without getting any command or in an inappropriate manner.
• Changed Homepage: A home page may get changed without being
done by the user.
• Strange messages: One may see strange error messages on a
computer such as «cannot rename the folder as a folder with the samename already exists»
1.4.5 Anti-virus installation
• In this case Kaspersky 2017 is going to be used as an example of how
to install an antivirus. Before the installation of Kaspersky 2017 on a
computer, the following preparation has to be made:
• Make sure that the software is on external storage device or on another
computer which is on the network;
• Check if the computer meets the requirements of Kaspersky Anti-Virus 2017;
• Make sure no antivirus software of Kaspersky Lab or other vendors is
installed on your computer;
• Check if there is any incompatible software and remove it;
• Close all running applications;
• Check if it is Kaspersky Anti-Virus 2017 installation under Windows10, then click on the Desktop tile on the start screen.
Standard Installation:
1. Download the installation file from Kaspersky Lab website and run it.
Then, the user follows the instructions given by the system.
2. If the antivirus Kaspersky installation file is saved in another computer
on the same network, connect to that computer and run the executive
file from it or move it using a removable storage. The instructions will be
followed as in the point above
3. Insert the disc into the CD/DVD drive if it contains the Kaspersky
installation file. If the installation does not start automatically, run theinstallation file manually. Click Install.
1.Read the License Agreement in the window that appear afterward by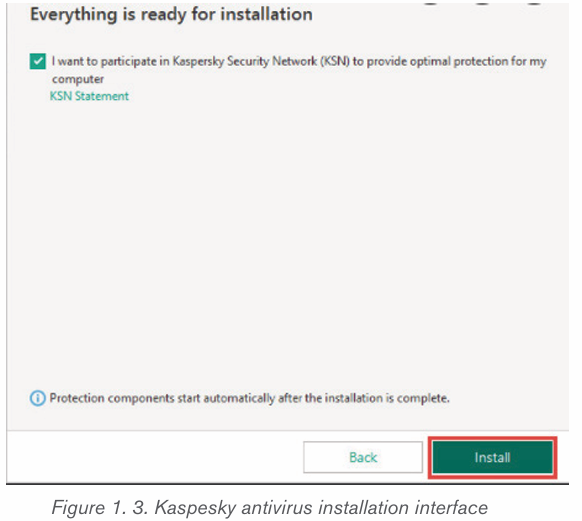
clicking on the respective link. Accept its terms to install the application.
Respond to other windows that may display as the installation continues
2.Wait until the installation is complete. Make sure the Start Kaspersky
Anti-Virus check box is selected, then click Finish
Note: A virus scan is the process of using anti-virus software to scan and
identify viruses in a computing device. It is recommended to scan any external
storage connected to computer before using it.
Application activity 1.4
1. Explain clearly what will happen If a computer is infected by virus
that shows the following signs or symptoms:
ii) Slow computer performance
iii) Frequent pop-ups
iv) Hard Drive issue
v) Frequent crashes
vi) Unknown programs
2. Give the difference between resident virus and non-resident virus3. What do you understand by executable virus?
1.5 Computer attacks
Activity 1.5
One day, an ICT teacher found the messages belowon some computers in
computer lab.
1. Discuss which kind of messages they are
2. Explain the reason why some computers may display the above
messages
3. Give the solution that can help the ICT teacher avoid those types ofmessages in computers
A Computer attack is any attempt to gain unauthorized access to a computer,
or computing system with the intent to cause damage. Computer attacks aim
to disable, disrupt, destroy or control computer systems or to alter, block, delete, manipulate or steal the data.
1.5.1 Ways of computer attacks
1. Virus
Viruses spread when the software or documents they get attached to are
transferred from one computer to another using a network, a disk, file sharing
methods, or through infected e-mail attachments. Some viruses use differentstealth strategies to avoid their detection from anti-virus software.
2. Trojans
A Trojan horse, or Trojan, is a type of malicious code or software that looks
legitimate but can take control of your computer. A Trojan is designed to
damage, disrupt, steal, or in general inflict some other harmful action on yourdata or network. A Trojan acts like a genuine application or file to trick you.
3. Worms
A computer worm is a program containing malicious code that attacks
host computers and spreads via a network. Network worms exploit security
vulnerabilities in various applications. Due to the availability of the Internet, theycan spread all over the world within a few hours of their release.
4. Website Hacking
Attackers can run code, install malware, steal or modify data by exploiting
vulnerabilities. Typically, hackers snoop around and crawl websites to identify
underlying vulnerabilities and weaknesses and accordingly, orchestrate attacksand data breaches.
5. Cybercrime
Hacking is identifying and exploiting weaknesses in computer systems and/or
computer networks. Cybercrime is committing a crime with the aid of computersand information technology infrastructure.
6. Unwanted content
Unwanted content can come in various different forms and can have a negative
impact on how things are perceived. It is generally personal information that
is displayed on a computer when connected to the internet without the user’sconsent.
7. Attacks through computer network
Actions taken through the use of computer networks to disrupt, deny, degrade,
or destroy information resident in computers and computer networks, or thecomputers and networks themselves.
Examples :
Unauthorized access.Distributed Denial of Service (DDoS) attacks.
8. Attacks by means of removable media
Data can be lost or sensitive data can be leaked. In many cases this data loss
comes at a high price both in reputational damage and financial loss. Another
security risk in the use of removable media is the introduction of malware fromone device to another.
Denial of Services attack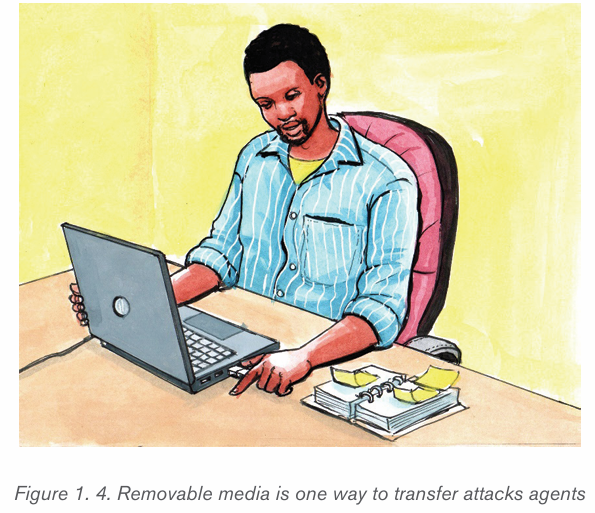
A denial-of-service attack is a cyber-attack in which the perpetrator seeks to
make a computer or network resource unavailable to its intended users bytemporarily or indefinitely disrupting services of a host connected to a network.
Application activity 1.5
1. Explain different ways of how a computer can be attacked.
2. What is a computer attack?
3. Identify any 5 examples of computer attacks
4. Visit you school computer laboratory and detect whether there aresome computers which have been attacked or not.
1.6Threats protection
Activity 1.6
A group of O’level students went to do a research in computer laboratory
and found that some computers have those messages as shown on the
images below. They tried to close those messages but still the computersdid not work properly.
1. Explain why those messages were displayed on the computer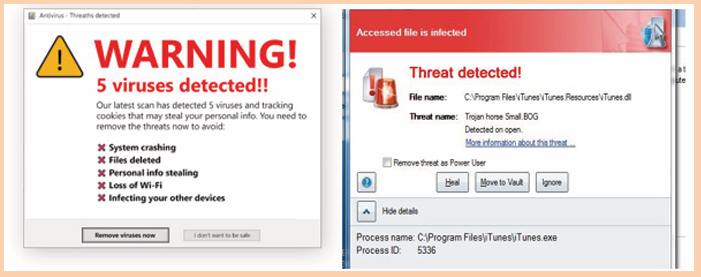
screens.2. Explain can be done in order to make those computers work properly
1.6.1 Computer antivirus
There are many antiviruses, which are programs that can help to protect a
computer from viruses. It scans the system and cleans the viruses detected
during the scan. Some of the popular antiviruses include Avast, Quickheal,
McAfee, Kaspersky, etc
• Basic functions of Antivirus Engines:This is the core of any antivirus
product. All antivirus engines have three components to function
accordingly. It is important to understand these functions because it
will help for better manual cleaning of viruses.
• Scanning: When a new virus is detected in the cyberspace, antivirus
producers start writing programs (updates) that scans for similar
signature strings.
• Integrity checking: This method generally checks for manipulated
files in OS from the viruses.
• Interception: This method is used basically to detect Trojans and it
checks the request made by the operating system for network access.
The following image shows the schema for an antivirus engines functionality.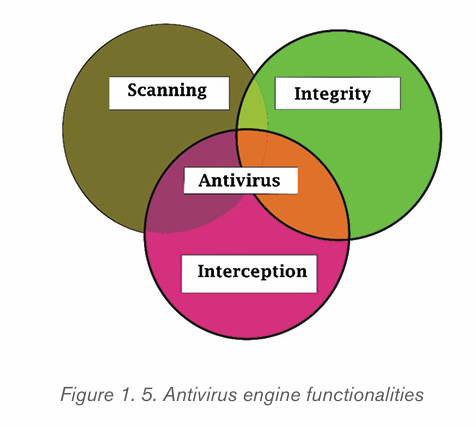
Types of anti virus
1. Free Antivirus Software
The free versions of anti-viruses have nearly identical malware detection scores
to the paid versions produced by the same company, but the commercial
antivirus makes a small difference in the performance of security. Examples
of such antiviruses are Avast Antivirus, AVG Antivirus, Panda Antivirus,
Bitdefender Antivirus, and Microsoft Security Essentials. When the
computer to be installed is a server, there will be a need to have a commercial version
2. Commercial Antivirus
These are the ones that are got after paying a fee. The buyer then gets a key
that will be entered when the antivirus is being installed. Note also that all the
producers of the free antiviruses offer their commercial versions. Some of
the commercial antiviruses are: Kaspersky Anti-Virus, McAfee AntiVirus Plus,
Webroot Secure Anywhere Antivirus, and Bitdefender Antivirus Plus Theseantiviruses can be downloaded as free trials from the maker’s websites.
The Kaspersky Antivirus has an excellent score in anti-phishing and gives a
useful bonus in security tools like credit card protection in computers. McAfee
Antivirus Plus can protect all the operating systems like Windows, Mac OS,
Android, and iOS devices and has very good malicious URL blocking and anti
phishing. Webroot SecureAnywhere Anti virus has features like recovery of files
encrypted by ransomware, very fast scan, handles unkown malware and usessmall amount of disk space.
When using the above type of antivirus, modified, replaced or deleted files and
the shared libraries should also be checked. They generally infect executable
program files with extension like .EXE, .DRV, .SYS, .COM, .BIN. Malwares
changes extension of genuine files, for example: File.TXT to File.TXT.VBS.
For the system administrator of a webserver, be aware of another form of malware
which is called webshell. It generally is in a .php extension but with strange file
names and in an encrypted form.When those types of file are detected from any
computer, they must be deleted.• Detecting a Computer Error from a Virus Infection
This section explains how to detect a computer or OS fault from a virus because
sometimes people and system administrators mix the signs.
The following events are most likely not caused by a malware:
• Error while the system is booting in bios stage, like Bios’s battery cell
display, timer error display.
• Hardware errors, like beeps RAM burn, HDD, etc.
• If a document fails to start normally like a corrupted file, but the other
files can be opened accordingly.
• Keyboard or mouse doesn’t respond to any commands
• Monitor switching on and off too often, like blinking or vibrating, this isa hardware fault.
On the other hand, the following signs in a computer system are caused by malware:
• The computer shows a pop-up or error tables.
• Freezes frequently.
• It slows down when a program or process starts.
• Third parties complain that they are receiving invitation in social media
or via email by computer user.
• Files extensions changes appear or files are added to the system
without computer user consent.
• Internet Explorer freezes too often even though the internet speed is
very good.
• Hard disk space is full all the time, even when there seem to be few files
and folders in the computer.
• Files and program sizes changes comparing to its original version.• Installation of an antivirus
To install an antivirus program on a computer, follow the steps below:
Insert the CD or DVD into the computer’s disc drive. The installation process
should start automatically, with a window opening to guidance through theinstallation process.
• If the antivirus program is downloaded from the Internet, find the
downloaded file on computer. If the downloaded file is a zip file, unzip
the file to extract and access the installation files. Look for a file named
setup.exe, install.exe, or something similar, then double-click that file.
The installation process should start, with a window opening to helpguide through the install process.
1.6.2 Anti-Spyware
Anti-spyware is a type of software that is designed to detect and remove
unwanted spyware programs. Spyware is a type of malware that is installed on
a computer without the user’s knowledge in order to collect information about
them. This can pose a security risk to the user, but more frequently spyware
degrades system performance by taking up processing power, installing
additional software, or redirecting users’ browser activity.
Anti-spyware is an antivirus software primarily utilized to scan a hard disk
for viruses, worms, and Trojan horses, and removes, fixes, or isolates any
threats that are found. Antispyware software scans the hard disk and registry for
traces of spyware and adware to removes them or prompt the user to removethem.
For preventing a computer to be affected by spywares the installation of an anti
spyware is needed. Such anti spyware are: TotalAV, Outbyte PC Repair, Restoro,Advanced SystemCare, Iolo System Mechanic, Malwarebytes Adwcleaner, etc
Applying antispyware
The computer user can download and install a free or commercial AntiSpyWare
then run it and scan the computer as it was done for antivirus to remove foundspyware.
1.6.3 Firewalls
Firewall is a network security device that monitors and filters incoming and
outgoing network traffic based on an organization’s previously established
security policies. It can be a At its most basic, a firewall is essentially the barrierthat sits between a private internal network and the public internet.
A firewall can be a hardware or a software. Afirewall can help protect a network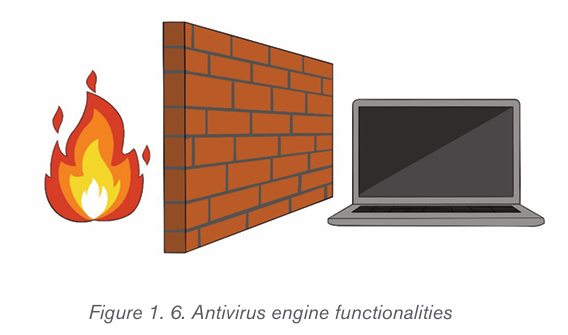
by acting as an intermediary between the internal network and outside traffic. It
monitors attempts to gain access to the operating system and blocks unwanted
incoming traffic and unrecognized sources. The Benefits of a firewall include
among others preventing hackers and remote access, protecting data, networkmonitoring, protecting against Trojan and other malicious software, etc.
Firewalls are also categorized based on how they operate. Based on theirmethod of operation, below are different types of firewalls:
3. Packet Filtering Firewalls
Packet filtering firewalls are the oldest, most basic type of firewalls. Operating
at the network layer, they check a data packet for its source IP and destination
IP, the protocol, source port, and destination port against predefined rules to
determine whether to pass or discard the packet. Packet filtering firewalls are
essentially stateless, monitoring each packet independently without any track
of the established connection or the packets that have passed through that
connection previously. This makes these firewalls very limited in their capacityto protect against advanced threats and attacks.
Packet filtering firewalls are fast, cheap, and effective. But the security theyprovide is very basic.
4. Circuit level gateways
Circuit-level gateways verify established Transmission Control Protocol (TCP)
connections and keep track of the active sessions. They are quite similar to
packet filtering firewalls in that they perform a single check and utilize minimal
resources. Primarily, they determine the security of an established connection.
When an internal device initiates a connection with a remote host, circuit-level
gateways establish a virtual connection on behalf of the internal device to keepthe identity of the internal user hidden.
5. Stateful Inspection Firewalls
They verify and keep track of established connections to perform packet inspection
to provide better, more comprehensive security. They work by creating a kind of
table with source computer addresses, destination computer address, source
computer port and destination computer port once a connection is established.
They create their own rules dynamically to allow expected incoming network
traffic instead of relying on a static set of rules based on this information. Theytherefore drop data packets that do not belong to a verified active connection.
6. Application level Gateways
Also called Proxy Firewalls, application-level gateways are implemented
at the application layer via a proxy device. Instead of an outsider accessing
your internal network directly, the connection is established through the proxy
firewall. The external client sends a request to the proxy firewall. After verifying
the authenticity of the request, the proxy firewall forwards it to one of the internal
devices or servers on the client’s behalf. Alternatively, an internal device may
request access to a webpage, and the proxy device will forward the requestwhile hiding the identity and location of the internal devices and network.
1.6.4 Access control
Every computer user needs access to a password that is shared with them.
The user makes a request to access the password. The request is sent to thedesignated administrator(s) for approval.
1. Main category of users
• Administrator
An administrator is someone who can make changes on a computer that will
affect other users of the computer. Administrators can change security settings,
install software and hardware, access all files on the computer, and make
changes to other user accounts.
• Local user
Local user accounts are stored locally on the server. These accounts can be
assigned rights and permissions on a particular server, but on that server only.
Local user accounts are security principals that are used to secure and manage
access to the resources on a standalone or member server for services or users.
To create a new user account in Windows 10, follow these steps:
1. Right-click the Windows Start menu button.
2. Select Control Panel
3. Select User Accounts .
4. Select Manage another account .
5. Select Add a new user in PC settings .
6. Click on “I don’t have this person’s sign-in information”
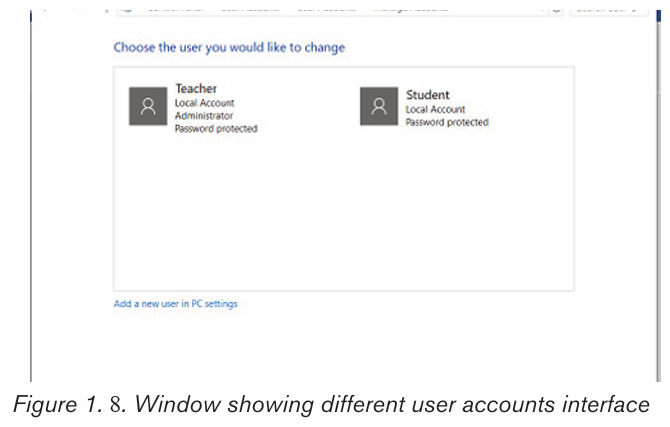
7. Click on Add a user without a Microsoft accountAfter following all these steps, the following window will be displayed :
1. On the above window, enter the username and the password the new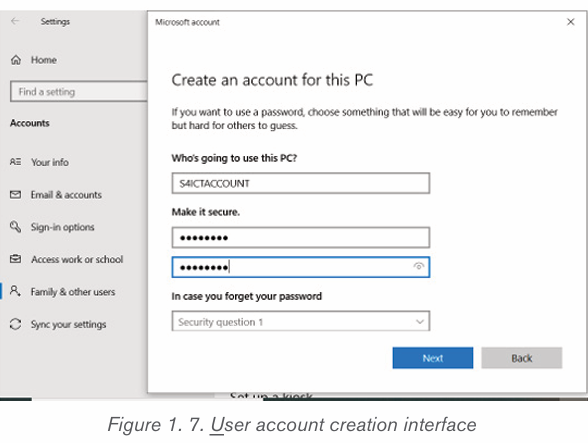
user will use to login.
2. Choose and answer the questions which help in recovering an account
when the password is forgetten.
3. After clicking on Next, a new user account will be created.
Note: The Administrator account is the first account that is created during
the Windows installation. The Administrator account has full control of the
files, directories, services, and other resources on the local computer. The
Administrator account can create other local users, assign user rights, andassign permissions.
Application activity 1.6
1. Describe different functions of an anti virus
2. Differentiate AVG anti virus to Microsoft security essentials
3. Briefly differentiate the types of firewall
4. a) At your school, the anti-virus used or installed in computers is for
how many users ?
5. b) Suppose that, the anti-virus keys are stolen by someone else to
use it on network. What can be the consequences for that anti-virus
users in that school ?6. c) How the computer users can avoid that illegal action ?
Activity 1.7
In the school computer laboratory, to enter in a secured computer with
password, someone needs to be given that password. If it has been
forgotten, it becomes impossible to work with that computer. Answer the
following questions :
1. What is the importance of login to computer with password ?
2. List other security measures that can be used to protect a computer.3. Explain how data stored in computer can be protected from damage ?
1.7 Threat prevention
Computer viruses can easily spread through the internet and email, causing
potential harm to a computer’s data, files and hard drive. Viruses are commonly
disguised as hyperlinks, pop-ups or email attachments of images, greeting cards,
audio or video files. Use the following instructions to help keep the computersafe from viruses, hackers and other malicious attacks.
1. Use Strong Passwords
It is very necessary to keep data safe by creating unique, complex passwords.
The best passwords include a mix of numbers, letters, and symbols and are atleast 8 characters long.
2. Keep everything up to date
Another basic step to take is to make sure you have the latest versions of all
software installed on your devices. The importance of this is because software
updates include features designed to withstand the latest security threats.
Microsoft, Oracle, and other makers regularly update their software to eliminate
“bugs” that hackers could exploit.
If a computer has an operating a system from many years ago, it’s defenseless
against any viruses or malware recently developed. Make it a habit to install allnew software updates as soon as they become available.
1. Use Antivirus Software
Antivirus software acts as a “vaccine” against virtual viruses. It can identify andeliminate the threat that could harm a computer.
2. Use a Firewall
Using antivirus programs doesn’t automatically mean that there is a firewall in a
computer. Macs computers come with pre-installed firewall software. Make sureit’s enabled to provide an extra layer of protection from viruses and malware.
3. Install a popup blocker
Many attacks happen through browsers, during everyone’s daily activities.
Hackers can gain access to any computer from one innocent click on the wrong
ad or link. An ad or popup blocker is essential to protecting any computer’s
data. It will prevent any unwanted pages from opening automatically. Never clickon, open, or download anything unless its source is known.
4. Beware of Email Phishing Scams
These appear in email form under the guise of a legitimate company. The goal is
to get the computer user to enter his/her personal information or to click on aninfected link that allows access to the computer.
Some companies will have their own domain name for emails. If an email address
claims to be from Paypal or Netflix but ends with @gmail.com, it’s a scam.Other
signs include misspellings, poor grammar, and suspicious attachments, buttons,
or links. A legitimate company will never invite you via email to log in and providepersonal or billing information.
5. Know the signs of infection
There are different signs which may make one think about a computer being
onfected such as repeated error messages, unexpected shutdowns, a sudden
slowing down of a computer, a computer taking too long to shut down or restart,
new unknown toolbars, etc. Any of these signs could mean that the computeris infected.
6. Consider additional security features
At the very least, it is better to perform weekly or even daily backups of all
important data. Store it securely in the cloud or on a separate hard drive.
That way, if the virus come accidentaly the vital information won’t be lost or
compromised. For extra protection, it is good to consider advanced security
measures like endpoint security. This protects not just not only the computerbut also the whole network.
Application activity 1.7
1. In group of 4 discuss the best practices that every user of the
computer should apply as routine in order to keep an installed
antivirus stronger.
2. Install an available antivirus in the computer lab, update it and scan
the full computer then report you observed during the whole process
up to the end.
3. Discuss the necessary recommendations to prevent viruses and
spywares from the computer4. Outline the signs of a computer which has been infected by virus
End of unit assessment 1
Part 1. Written
a) What is computer security ?
b) What is the purpose of computer security ?
c) With an example, explain how you can protect a computer from
physical threats ?
d) By using examples, explain access control in authorization
e) Which type of attack that enable a computer user to access his/
her e-mail address ?
f) Identify consequences of security violation in computer security
context
g) Discuss and write a brief report on the importance of computer
security at your school, in financial institutions and in education field
h) With an example differentiate the physical threats to logical threats
i) Explain the term “Executable virus”
j) It is heard that some web site become hacked by unknown
people. Which strategies can be used to avoid young Rwandan
programmers to engage in that action ?
k) Using an arrow match the following in Group A with their
corresponding in Group B
Part 2. Written
In school computer lab, every student takes a computer and do the following
activities :
i) Create a user name and password to enter in that particular computer
ii) Add a new user on the computeriii) Update the anti-virus found on the computers
To set a paragraph spacing follow these steps:
2. Type the list, pressing Enter once to insert another bullet. When fini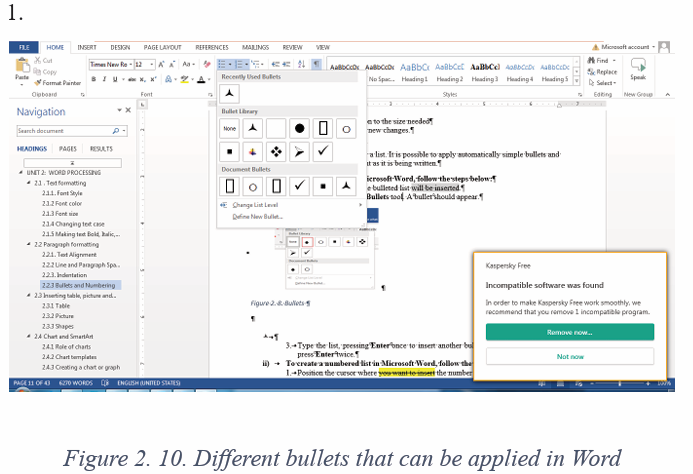
shed, simply press Enter twice.
i) To create a numbered list in Microsoft Word, follow the steps below.
1. Position the cursor where the numbered list will be inserted.
2. In the Home tab, click the Numbering tool. A number One should appear.UNIT 2 :WORD PROCESSING
Introductory activity
1. The head teacher of your school buys a new computer which has
no software in it. He/she needs to prepare a report which to be
send to the District. What are the system software and application
software that the head teacher will need to achieve his purpose.
2. You are asked by your head teacher to prepare a document
presenting the features of your school specifically its historical
background, Vision and mission, performance, statistics about
students and officers.
iii) Give steps used to launch application software that will be used to
perform this task
iv) The document to be created must comply with the following:
v) It has titles and has highlights of words to which more attention
is needed. (The highlighted word can be made as: Bold, italic,
underlined depending on the preferences)
vi) It has attractive colors depending on school preferences
vii) It contains a table to present the school statistics information.
viii) It has a school image as the first page
ix) It contains the hierarchy of officers in the school which is created
using smart chart
x) Has a header “My beautiful School” and footer as “Cantered page
number”.
xi) Create a table of content for this document and save it on “My school”as file name.
2.1 Text formatting
Activity 2.1
1. Open the new document of MS word
2. Name each icon commands by make a pointer/curser on each
icon from Font groups in home tab as shown on the below figure: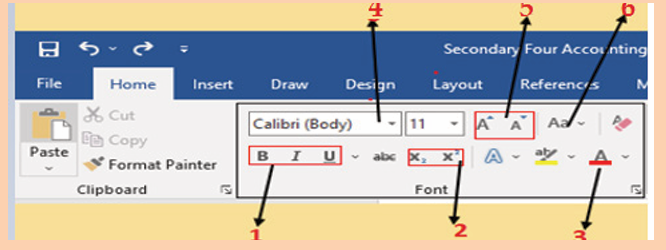
3. Write a function of each command from 1 to 6
Formatting is the process of enhancing the appearance of a document, making
it attractive. Text formatting involves enhancement of the appearance of the text.
Some of the common text formatting features includes font style, font size, fontcolour, underline, change case and among others.
2.1.1.Font Style
By default, the font type of each new document is set to Calibri. HoweZer, Ms
Word provides many other fonts to use in customizing the text. To change text’s
font style/font face go through these steps:
1. Select the text to modify
2. On the Home tab, click the drop-down arrow next to the Font box. A
menu of font styles will appear.
3. Select and click on the font type to apply. Immediately the font stylechanges.
2.1.2 Font color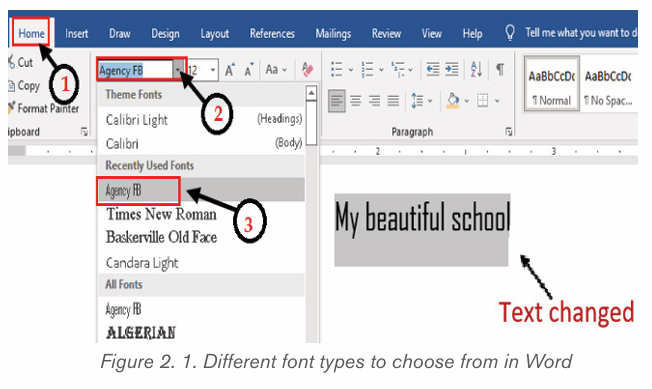
The most common font color for word text is automatic (near black) but there
are other fonts available. To change the font color:
1. Select the text to modify.
2. 2. On the Home tab, click the Font Color drop-down arrow. The Font
Color menu appears.3. 3. Select the font color to use. The font color will change in the document.
The color to choose from are not limited to the drop-down menu that appears.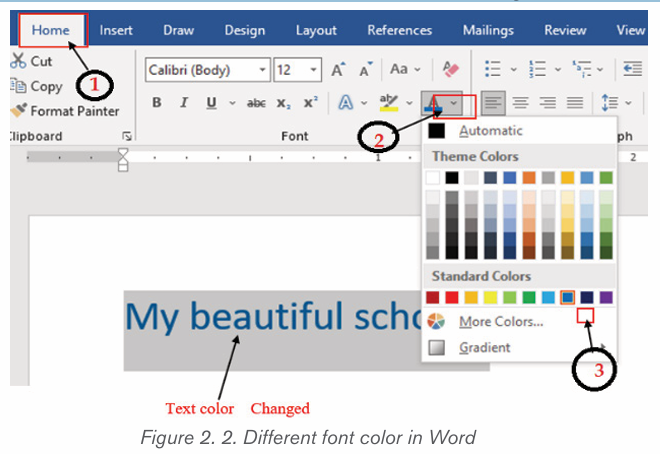
Select More Colors at the bottom of the menu to access the Colors dialog boxand choose one of the colors.
2.1.3 Font size
The most used size of word characters is 12, however character size in Word
varies from 1 to 72 but can be increased even up. To change the font size go
through the following steps:
1. Select the text for which the size is going to be changed. For example
type and select the text “My beautiful School”.
2. Click on the Home tab and click the Font size command from the Font
group then choose the desired size like 36. In the figure below the fontsize of the text is now changed to 36.
Note: It is possible to change the font size using the Increase Font Size and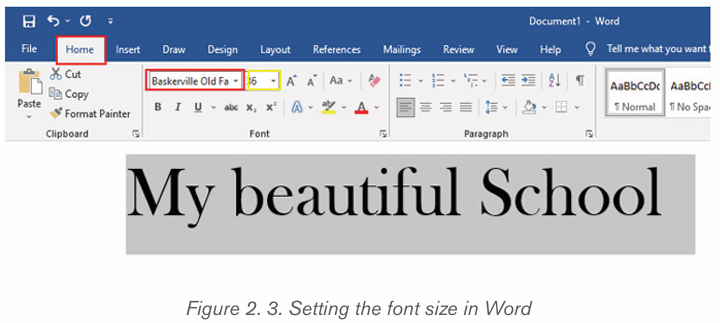
Decrease Font Size commands
2.1.4Changing text case
The text case is about the presentation of characters in words. The available
cases are: Sentence case, Lower case, Upper case, Toggle case and Capitalize
each Word. To change the case:
1. Select the text for which to change the case.
2. On the Home tab, click the Change Case command in the Font group.
3. A drop-down menu will appear. Select the desired case option from themenu
• Sentence case: It capitalizes the first letter of each sentence.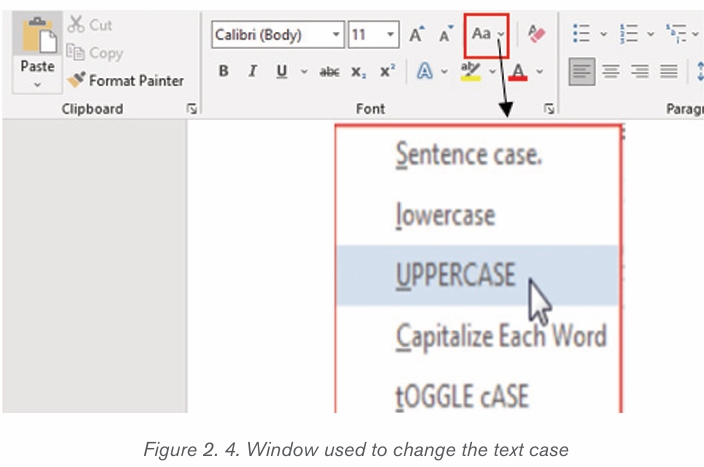
• Uppercase: It capitalizes all the all letters of your text.
• Capitalize Each Word: It capitalizes the first letter of each word.
• Toggle Case: It allows you to shift between two case views, e.g. toshift between Capitalize Each Word and cAPITALIZE eACH wORD .
2.1.5 Making text Bold, Italic, and Underlined
The Bold, Italic, and Underline commands are used to help draw attention toimportant words or phrases. To make text have these attributes do the following:
1. Select the text to modify.
2. On the Home tab, click the Bold (B), Italic (I), or Underline (U) commands
in the Font group
3. The selected text will be modified and made bold, italic and underlined
as in the next image if all the corresponding icons were clicked on as shown below.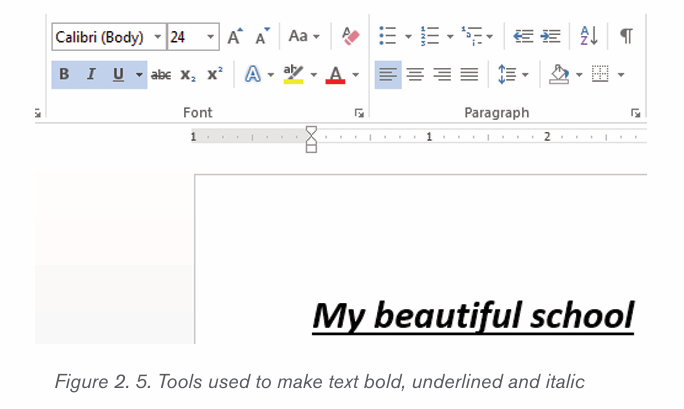
The functions of the used commands are given below:
• Bold: It allows to make the text bold
• Italic: It allows to italicize the text• Underline: It allows to underline the text
Application activity 2.1
1. What is the function of the following command in a
Word document?
b) (a) Font size, (b) Font color, (c) Font style, (d) Bold,
(e) italic, (f) Change case
3. 2. Write at least four lines of text which describes
“Your education background “and do the following:
iv) Change font type of the first and second sentences to
“Poor Richard”, font size to “14”, font color to “Blue”
and make the sentences italic.
v) Change the third and fourth sentence to the font type”
Tahoma”, font size “12”, font color “Red” and underlinethose sentences.
2.2 Paragraph formatting
A Paragraph format contains one or more lines with a combination of words,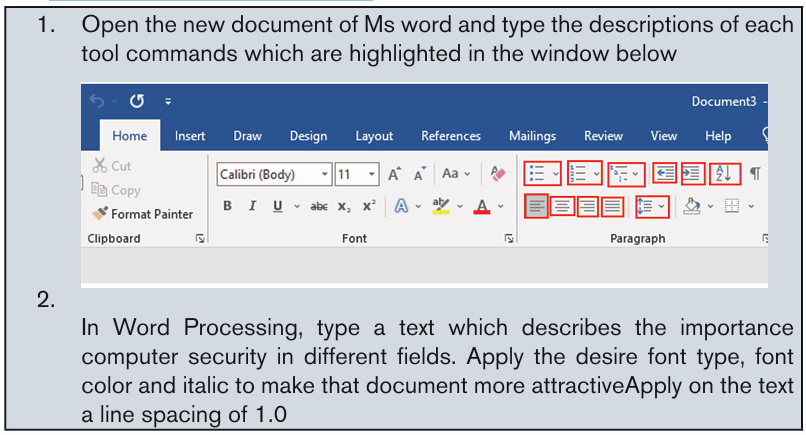
numbers and other characters. They are features used to improve the appearance
of an entire paragraph. They include among others Text Alignments, Bullets,
Numbering, Multi-Level list, Paragraph Indents, Sorting Text, Line Spacing and
many others.
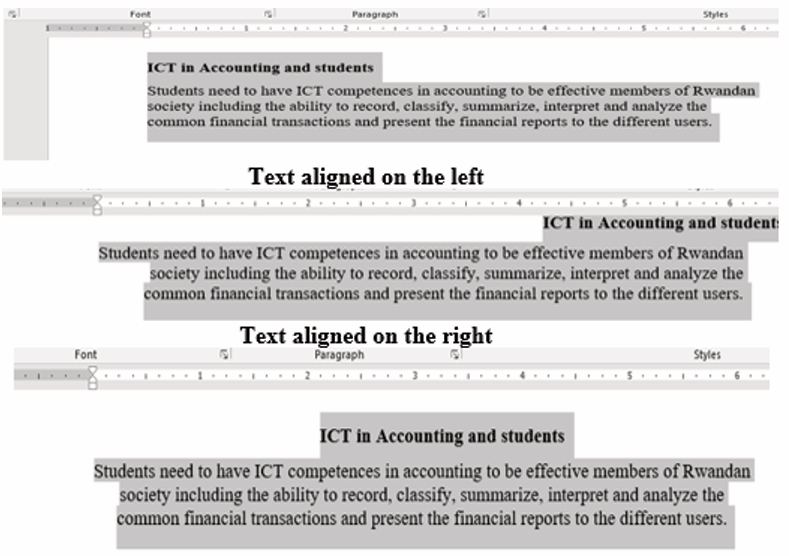
2.2.1. Text Alignment
It refers to the arrangement of text relative to the left or right margin of a page.
There are four types of alignments namely: Left, Right, Centre and Justifiedalignments.
Steps: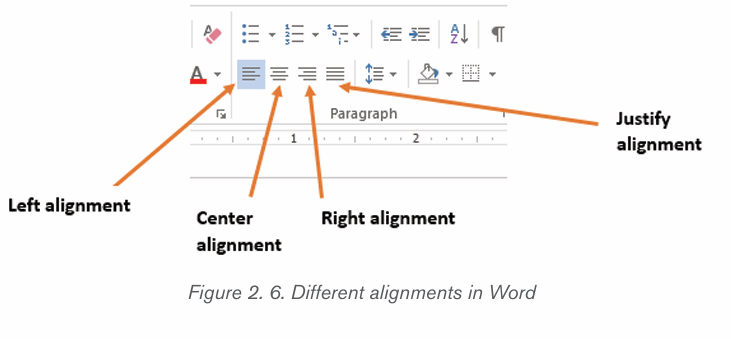
1. Select the text that needs to be aligned
2. On the Home tab, in the Paragraph group click either Align Left , AlignRight, Center or Justify command
2.2.2 Line and Paragraph Spacing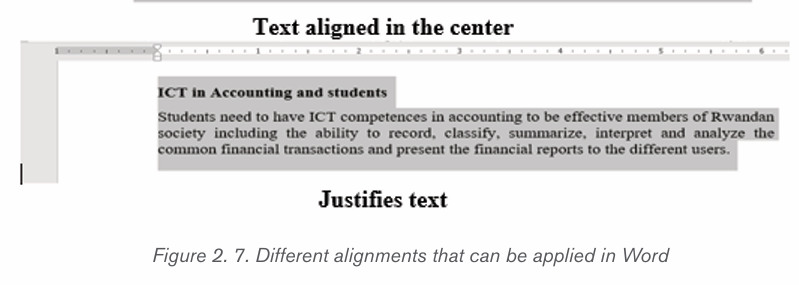
Line spacing determines the amount of vertical space between lines of text.
Microsoft Word uses single line spacing by default. The selected line spacing
will affect all lines of text in the selected paragraph or in the paragraph that
contains the insertion point.
To set a paragraph spacing follow these steps:
• Select all of the paragraphs for which the spacing is to be changed (or place
the insertion point anywhere in a single paragraph that needs to
be changed).
• On the Home tab, click the “Line and Paragraph Spacing”
command.• Choose the line spacing among the different options
The line spacing is shown in multiples. “2.0” is double spacing, “3.0” is triple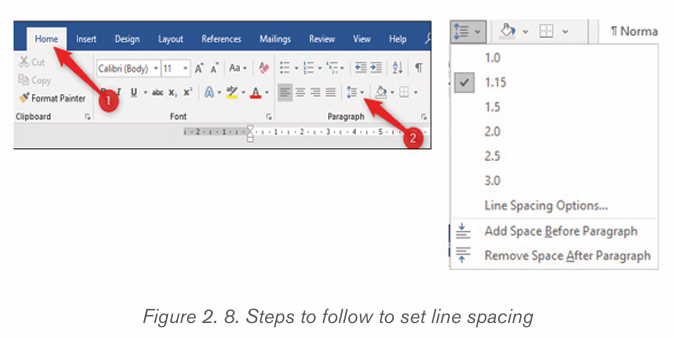
spacing, and so on. Select the line spacing needed and Word applies it to theselected paragraphs.
There is a way to choose another spacing, or revert to the original spacing,
click the “Line and Paragraph Spacing” option again and select a different linespacing.
2.2.3. Indentation
It is the process of moving text away from the right or left margins by a given
interval. There are four different types of indents that can be applied to aparagraph which are detailed in the table below:
i) To Create a Left Line Indent follow the following steps: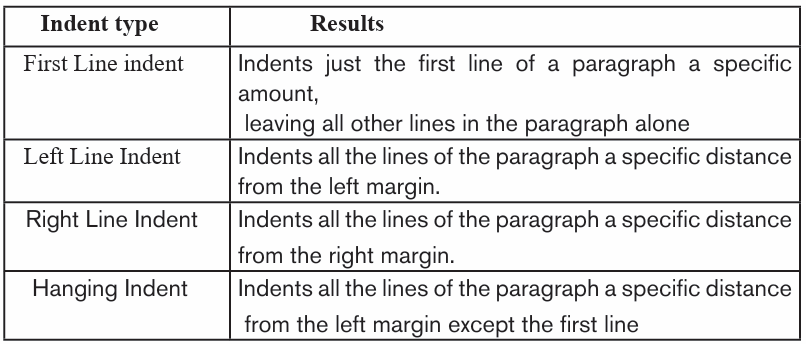
1) Position the cursor anywhere in the first paragraph of the document
2) In the Home tab, click on the icon on the right bottom corner of the
Paragraph group (Paragraph Settings)
3) In the dialog box that appears next to Alignment option, click on the
drop down arrow and choose Left. The other options available when thedrop down arrow is clicked are Right, Centered and Justified
4) In the Indentation options, increase the Left Indentation to 1 inch by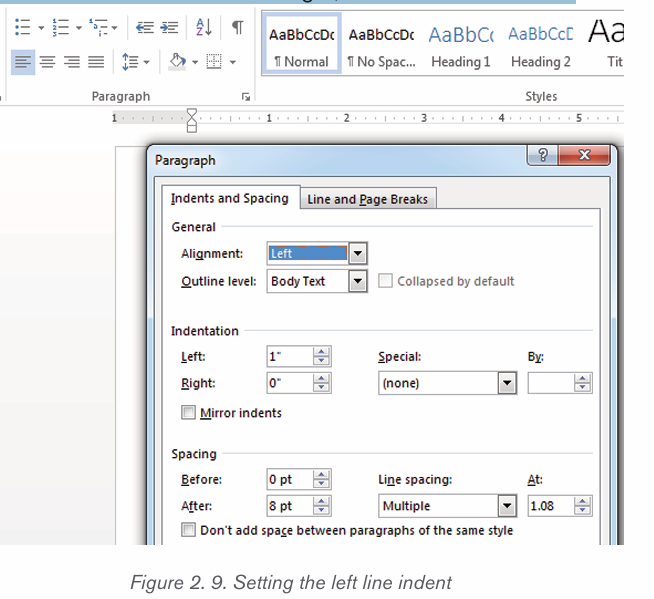
clicking the Up-scroll arrow
5) In the Spacing options, select the spacing to apply
6) To apply the new changes click OK
Note that all the lines from the left side of the first paragraph moved over 1 inch.
ii) To Create a Right Line Indent follow these steps
1) Position the cursor anywhere in the first paragraph of the document
2) In the Home tab, click on the Paragraph Settings icon from Paragraph group
3) In the new dialog box, next to Alignment options click on the drop down
arrow and choose Right.
4) Increase the indentation to the size needed
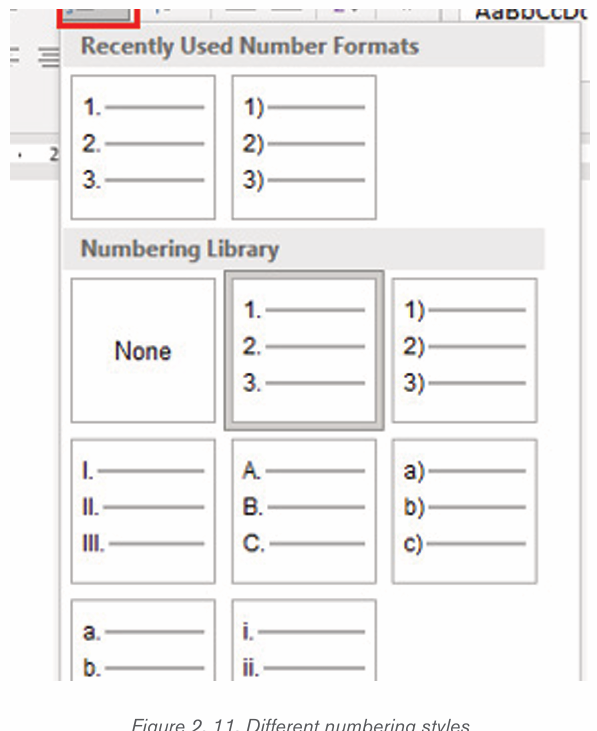
5) Click OK to apply the new changes.2.2.3 Bullets and Numbering
Bullets or numbering are used for a list. It is possible to apply automaticallysimple bullets and numbering to lists in the document as it is being written.
i) To create a bulleted list in Microsoft Word, follow the stepsbelow:
1. Position the cursor where the bulleted list will be inserted.
2. On the Home tab, click the Bullets tool. A bullet should appear.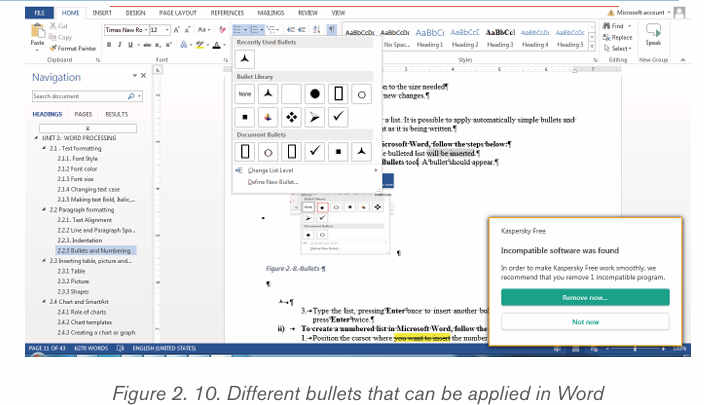
3. Type the list, pressing Enter once to insert another bullet. When finished,
simply press Enter twice.ii) To create a numbered list in Microsoft Word, follow the steps
below.1. Position the cursor where the numbered list will be inserted.
2. In the Home tab, click the Numbering tool. A number One shouldiii) Multilevel numberingappear.
Multilevel numbering creates a numberings in which some numbers areembedded among others therefore creating a logical hierarchy.
• How to set up multilevel numberingBefore applying multilevel numbering to a document, firstly apply heading style
to the heading text.
1. Select the text on which the numbering is to be applied
2. In the Home tab, click the Multilevel numbering icon inthe Paragraph group.
3. There is an option to select an existing layout from the list to use as a starting point
, or create a new numbering system from scratch. As you
hover over each thumbnail image, Word provides a larger image of the
numbering system.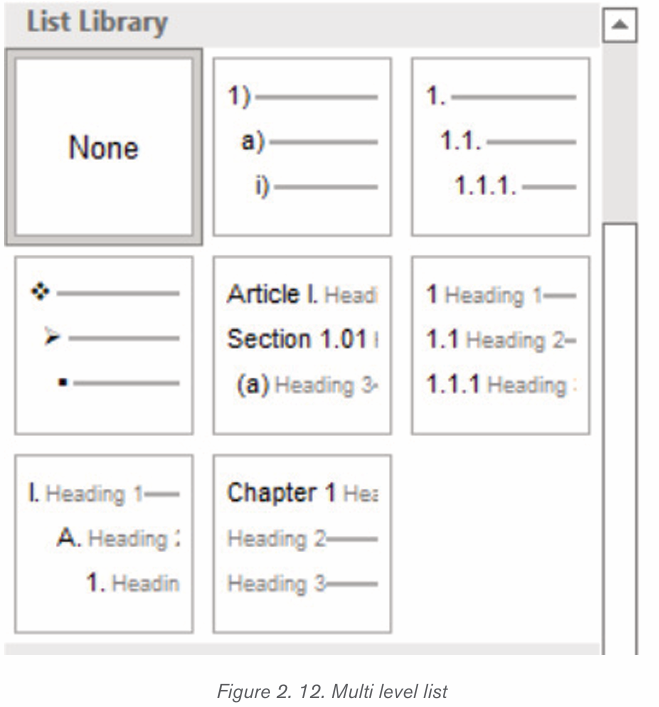
Application activity 2.2
1. Type text in word processing software which describe your school.
The first paragraph talks about school background, the second about
school Vision and weekly school schedule Save it as “Education”
and do the following
b) Apply on the text a line spacing of 1.0
c) Apply Right indent to the left on your first paragraph (school
background)
d) Apply left indent to the Right on your Second paragraph
(school Vision)
e) Apply the numbered list for weekly school schedule
paragraph
f) With bulleted list, retype the name of commands labeled
by numbers in activity 2.1
1. Select your school background then do the following:
a) Indent the first sentence,
b) Change the font type to “Time New Roman “, size =”12”,
line spacing =”2.0c) Change alignment from Left to Justified alignment
2.3.Inserting table, picture and Shapes
Activity 2.3
By doing a research, discuss the tools used in Word shown in the screenshot below:
MS Word allows for the insertion of many objects like Tables, Pictures, Shapes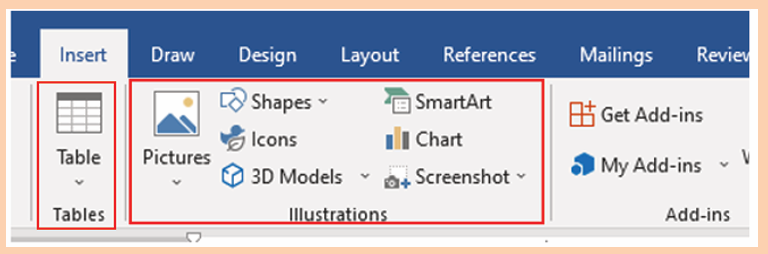
equations, Symbols, Word Art. These objects make a document more beautiful
and easy to understand. Those different objects are inserted in a document byusing the Insert tab.
2.3.1Table
A table is a feature that is used to present information in an organized layout
consisting of rows and columns which intersect to make a Cell. To create a
table, first determine how many columns and rows that it will have. In Word, thetool to make a table will look like the one shown below:
i) Inserting a table in document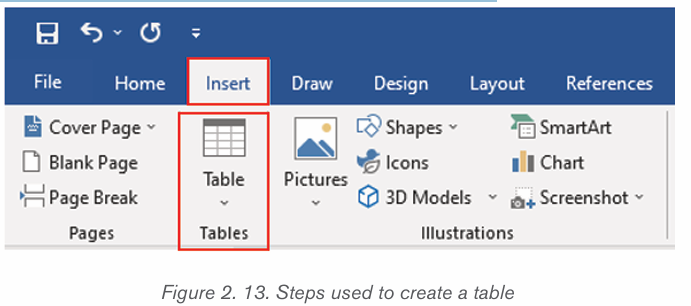
There are two ways of creating a table namely: Using the Graphic Grid andUsing the Insert Table feature.
a) Using the Graphic Grid
1. Position the cursor where the table is to be inserted.
2. Click on the Insert tab,
3. Click the Table tool and select the number of rows and columns that
are needed.
4. Use the grid to select how many columns and rows are needed. Choose
the number of columns and rows by dragging the mouse across the gridand then clicking the left mouse button on the lowest right square.
b) Using the Insert Table feature
– On the Insert tab, click the Table tool
– Click on Insert Table option
– In the dialog box that appears write the number of rows and columnsand click OK.
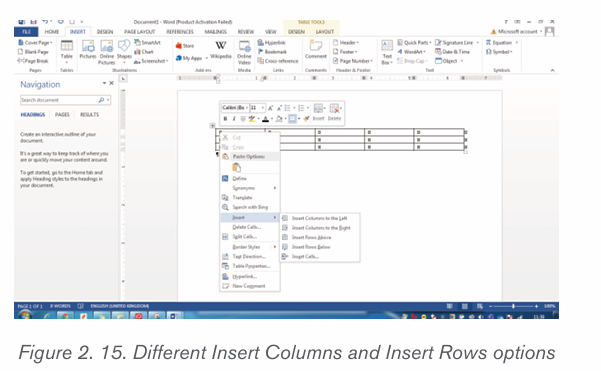
ii Add a Row or Column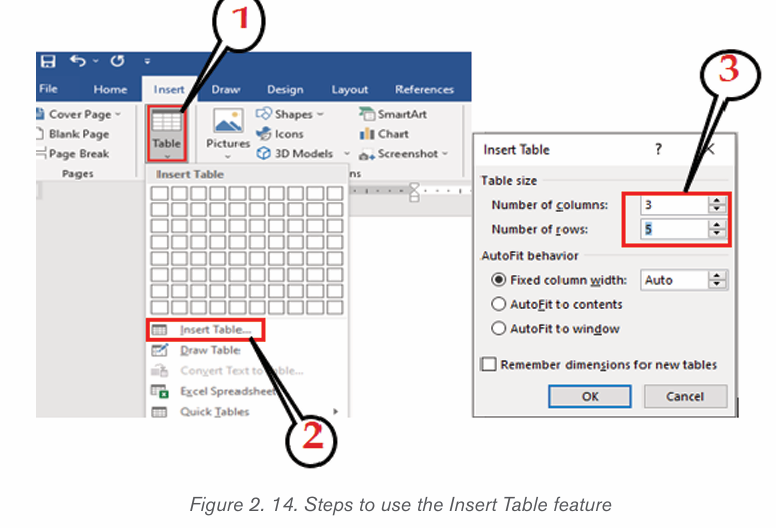
To add a new column or row in an already created table do the following:
Place the cursor in any cell within the column or the cell next to which the new
1. Place the cursor in any cell within the column or the cell next to which thenew column or row will be created and do a Right Click.
2. In the options that will appear click on Insert
3. Next to Insert option click on one of the insert options like Insert Columns
to the Left. The Insert column/row options are shown in the windowbelow:
iii.Delete a table Row or Column
There is an option of deleting a row or a column which is not needed in thecreated table. To do it follow these steps:
To delete a row:
1. Select the row to delete2. Do a Right Click and click on Delete Rows
To delete a column:
1. Select the column to delete2. Do a Right Click and click on Delete Columns
Formatting a table
Formatting a table is to give specific properties to a table, cell, row or columnsdepending on what the user wants.
a) Merging Cells and Splitting Cells.
Merge Cells command is used to combine more than one cells to
appear as one large cell while Split cells command is used to divide acell into more than one cells to make it appear as many different cells.
The following is the procedure for merging cells:
1. Select the cells to be merged.
2. Do a Right Click and choose Merge Cells.
For splitting cells, do the following:
a) Position the cursor in the cell to be split.b) Do a Right Click and choose Split Cells.
2.3.2.Picture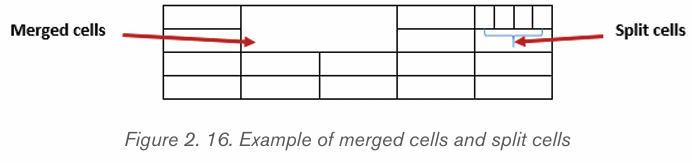
Images of picture that are generated by a computer are called computer graphics.
Examples are photographs, drawings, line art, mathematical graphs, line graphs,
charts, diagrams, typography, numbers, symbols, geometric designs, maps,
engineering drawings, or other images. Graphics often combine text, illustration,and color. A picture can be inserted from the Internet or from an existing file.
a) Inserting pictures from the Internet
1) Position the insertion point where the picture is to be inserted.
2) Click Insert tab from the menu bar in the Illustrations group and clickOnline Pictures icon.
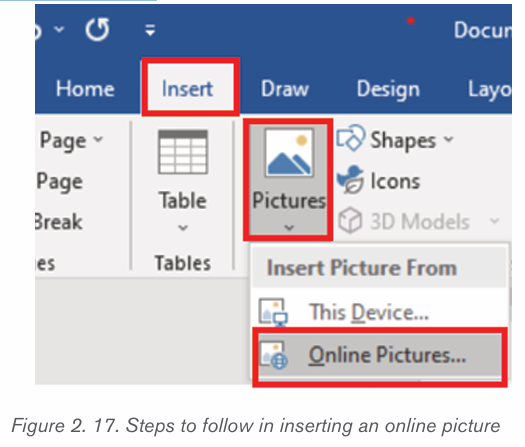
3) If there is Internet connection, a dialog box is displayed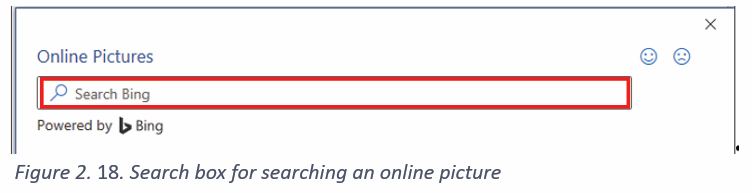
4) Type the name of the image to be located in the box provided.
5) Click on Go button to display the result on the window6) Click on the desired image then select Insert button
b) Inserting pictures from an existing file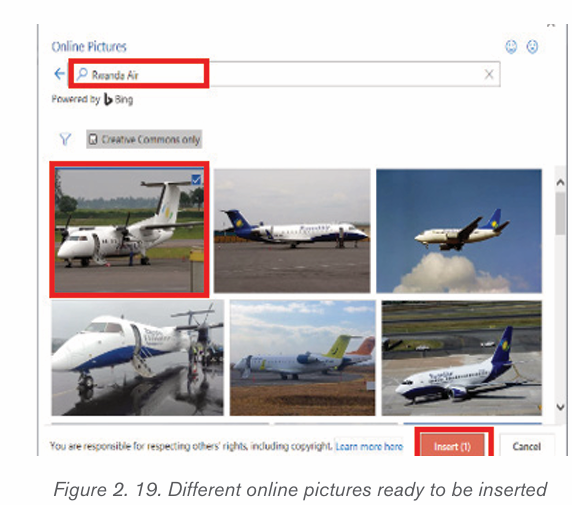
To insert a picture from an existing file is done by following these steps:
• In the Insert tab click on Pictures
• Browse in the computer folders the images to insert and click on Insertbutton
b) Cropping a picture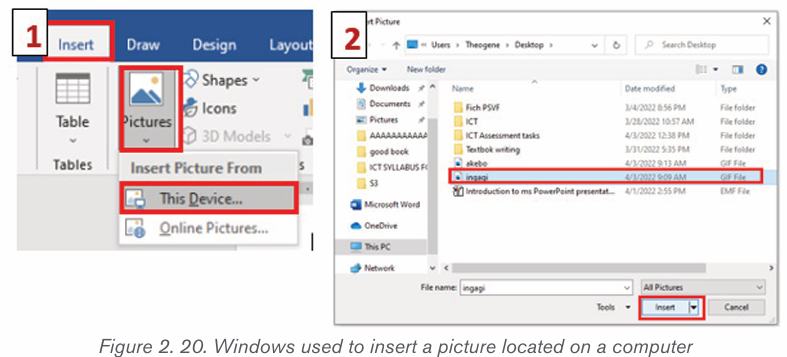
Cropping a picture is to reduce the size of that picture by removing undesirable
or unnecessary elements.
Cropping an image is done in the following way:
i) Select the picture by clicking it
ii) Click the Format tab in the Picture Tools ribbon group.iii) Click the Crop tool.
i) Crop handles appear on the sides and corners of the image. Hold down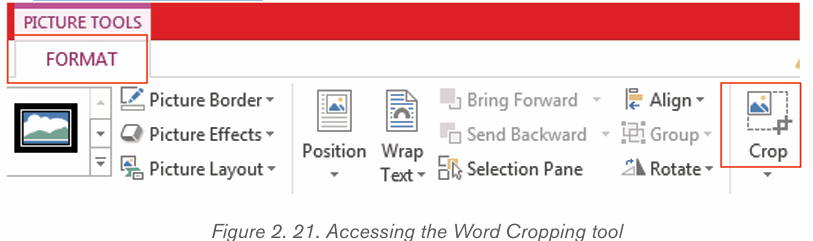
the left button of the mouse and displace the mouse depending on how
you want to crop the image
ii) Click and drag the crop handles where you want to crop.
iii) To crop all four sides of a picture or graphic at once while maintaining the
graphic’s proportions, press and hold down Ctrl as you drag the handles.iv) Click the Crop button again when you’re finished setting the crop area
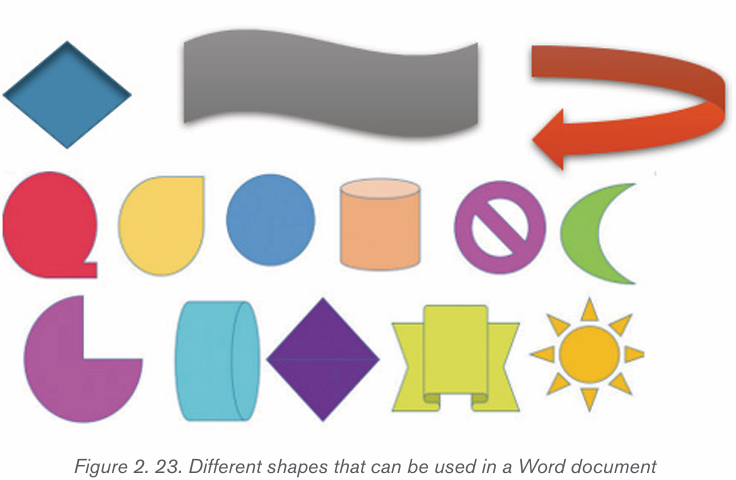
2.3.3. Shapes
A shape or figure is a graphical representation of an object or its external boundary,
outline, or external surface, as opposed to other properties such as color, texture, ormaterial type.
i) Adding shapes
Various shapes can be added in a Word document then formatted as requiredby the user. Follow these steps to insert shapes
1. Click on Insert tab from the menu bar,
2. Click Shapes icon from Illustration group. Different types of shapes
 appear as shown in the figure below
3. Click on the desired shape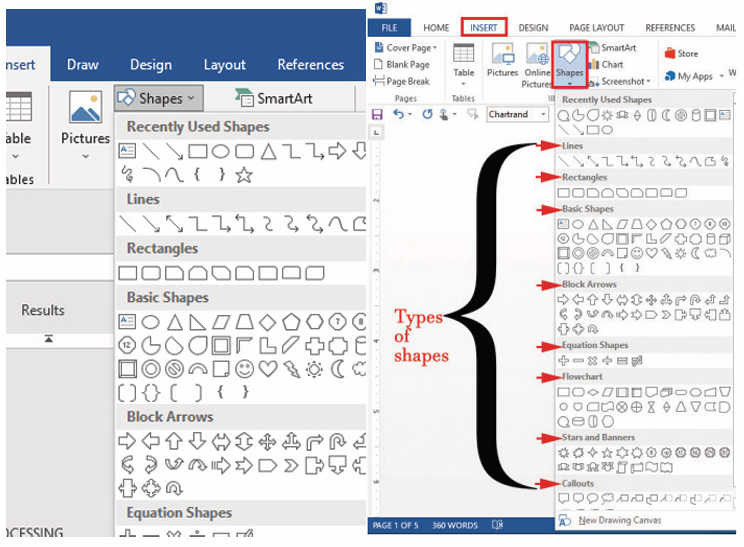
4. Position the pointer at the desired area of the document and drag it in the
desired direction to draw the shape by using the pointer which has now
changed to a plus sign.
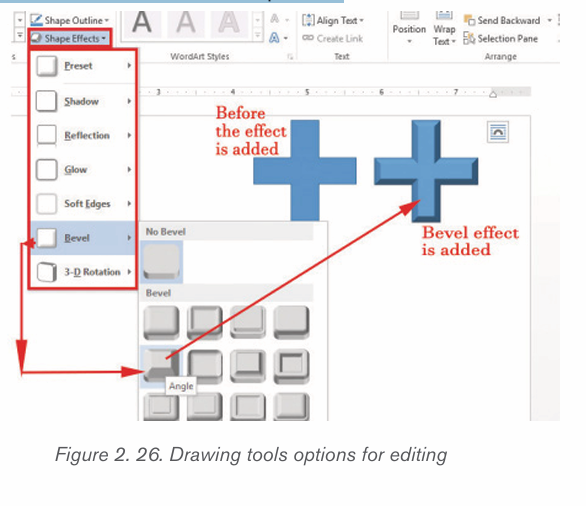
ii) Formatting Shapes
To format in this case means to arrange it in the desired way. Some formatting
styles that can be applied on a shape include the following: changing the shape;
rotating the shape to an angle; and grouping a number of shapes into one image.
1. Click the Shape Fill button from Shape styles in shape format
and select a color to change the shape’s fill color.
2. Click the Shape Outline button and select a color and weight for the
 shape’s outline, as well as dash and arrow styles.
Click the Shape Effects
 button and select a shape effect, such
as shadow, glow, or bevel.
1. Select a shape style preset from the Shape Styles gallery.
Click the gallery’s More button to see more presets
Application activity 2.3
1. Use the Graphic Grid create the following table and save it as table 1
a) Insert three columns to the right of the column containing house.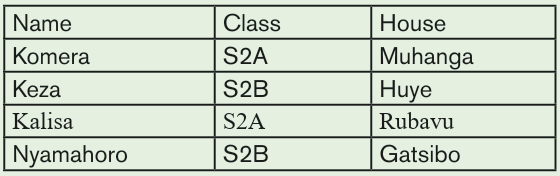
b) Add two rows after the row containing Nyamahoro details.
c) Add another row on top and include the title “Examination Analysis”
d) Save it as Table 2.
e) Delete Nyamahoro’s details.
f) Add the following details in the three columns added: Column
1(History, 67, 89, 98), Column 2 (Business, 77, 56, 34) and
column 3 (English, 74, 87, 65)
g) Merge the cells containing the title.
h) Split the cell containing the name Habimana into two.i) Save it as MyTable.
Activity 2.4
In the table below there is the price of a certain goods which increased from
2005 to 2022 as shown in the table below:How the above information could be interpreted without using table?
2.4 Chart and SmartArt
Smart charts are the charts by which we can show numerical facts
in visual form. It shows the relationship between two or more numbers or
quantities. It generally uses a tabular form, bar charts, line charts, pie charts, or
pictographs to display data
The Role of charts is: the following
• Charts are used to summarize and display information in an easy manner
to understand.
• Charts act as useful tools for conveying financial information.
• They are used to make patterns and trends in numerical order much
easier to see.
• Charts facilitate data analysis.
2.4.1. Chart templates
a) Bar Chart (Bar graph)
A bar chart is a graphic representation of data with horizontal bars or objects.
Bar charts usually display horizontal bars or objects going across the chartvertically, with the values displayed at the bottom of the chart.
b) Column Chart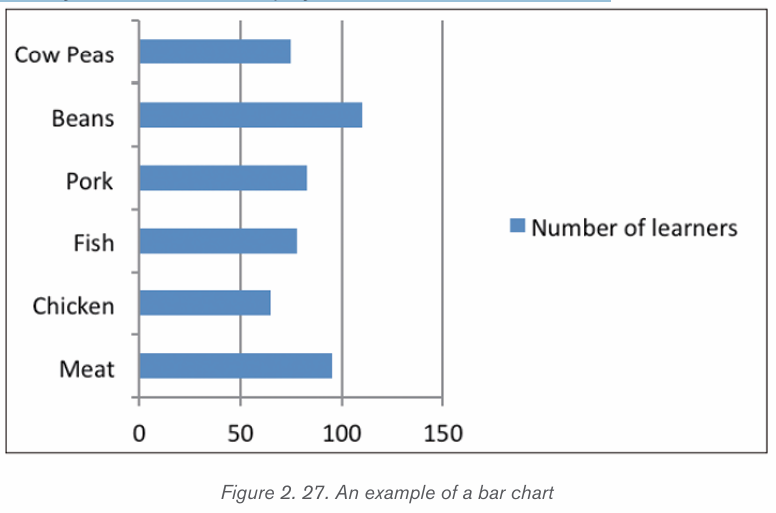
A column chart is a graphic representation of data with vertical bars or
objects. Column charts display vertical bars (categories) going across the
chart horizontally (along the horizontal axis), with the values organized along thevertical axis (on the left side of the chart).
c) Line Chart (Line Graph)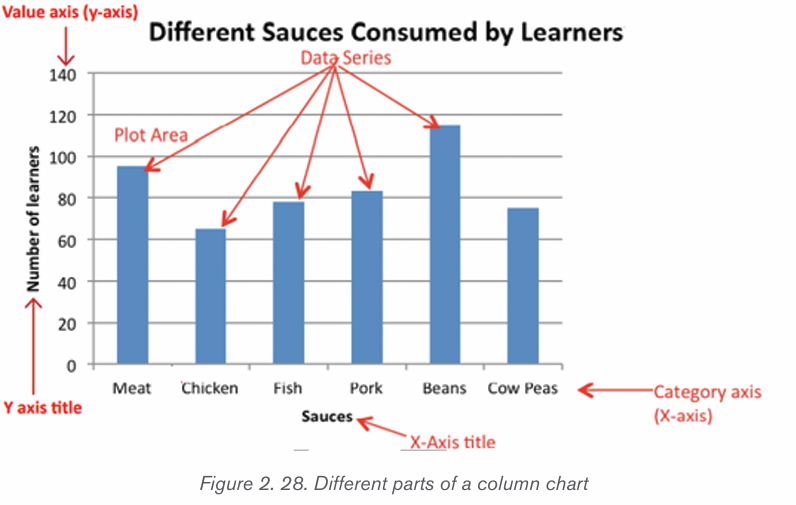
A line chart is a graphic representation of data plotted using a series of lines.
Line charts display lines going across the chart horizontally, with the values axisbeing displayed on the vertical axis (left side of the chart).
d) Pie chart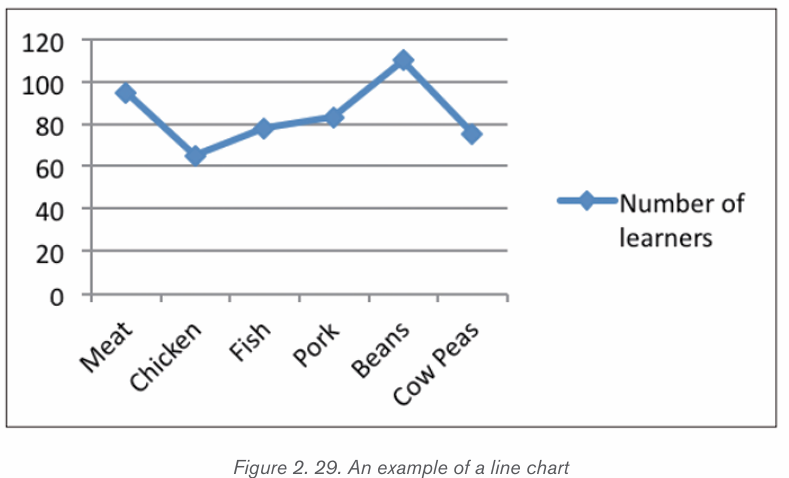
This is a circular chart sliced into sections; each section represents a percentage ofthe whole. Pie charts do not display horizontal and vertical axes as other charts.
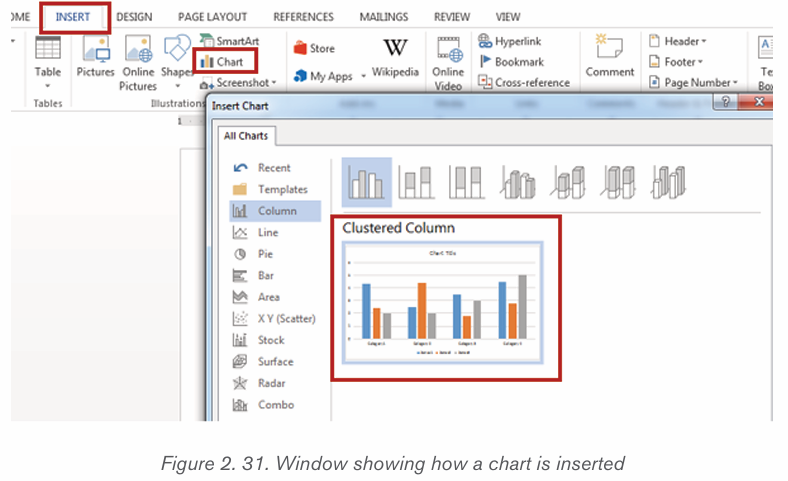
2.4.2.Creating a chart or graph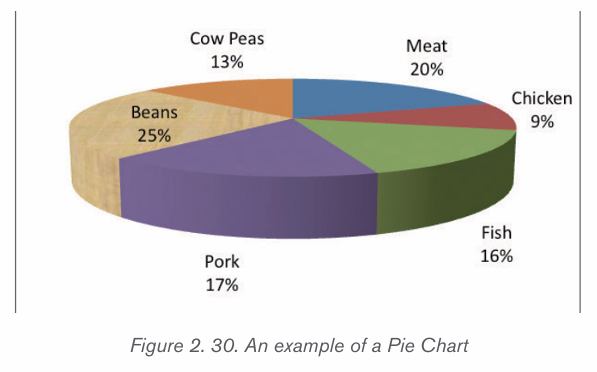
1. Prepare the data that is going to be used in making the chart
2. In Word, click where the chart will be placed.
3. On the Insert tab, in the Illustrations group click Chart.4. Click on the type of chart to be inserted
1. The inserted chart is a default one. Edit the chart data so as to have theneeded chart
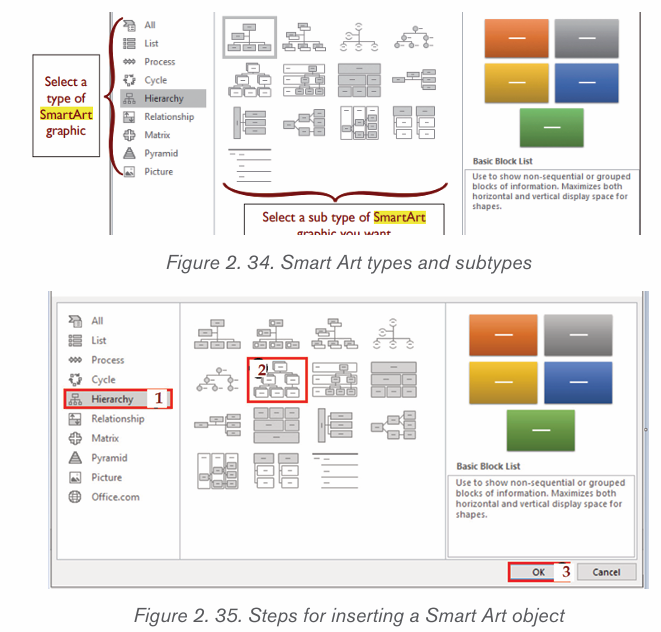
2.4.3. Insert Smart Art Graphics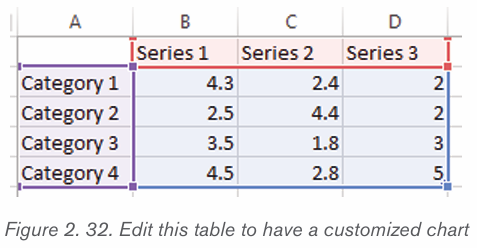
SmartArt is a picture used to communicate information in many different ways.
It is an option that allows the user to create diagrams easily. Inserting Smart
Art Graphics in a document is another way to communicate effectively the a
message. Smart Art Graphics are :a list, process flow, cycle, a relationship or
an organization hierarchy, Matrix Pyramid and chart. The steps to insert smart art
graphics are outlined below:
1. Place the insertion point in the document where the SmartArt graphic
will appear.
2. From the Insert tab, select the SmartArt command inthe Illustrations group.
3. A dialog box will appear. Select a category on the left, choose the desired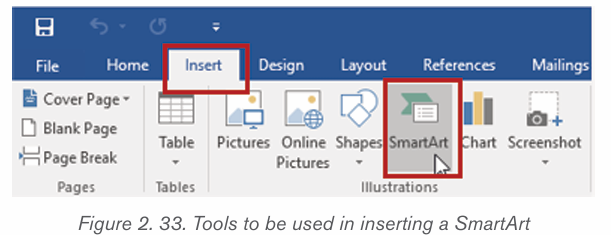
SmartArt graphic, then click OK.
5 Select the SmartArt graphic. The text pane should appear on the left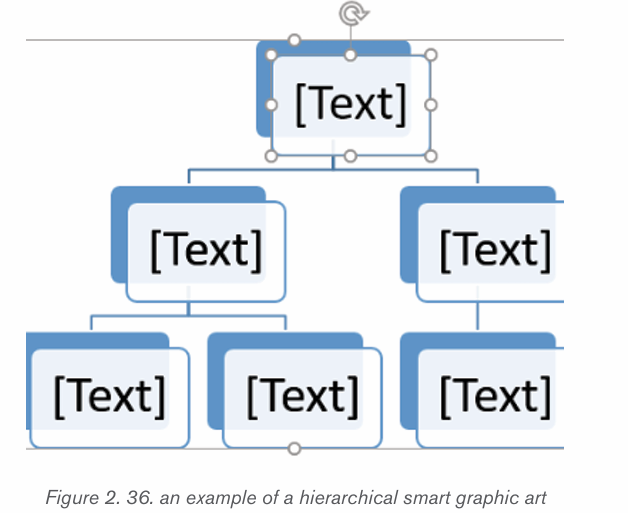
side. If it doesn’t appear, click the small arrow on the left edge of the graphic.
6. Enter text next to each bullet in the text pane. The text will appear in
the corresponding shape. It will be resized automatically to fit inside theshape.
Application activity 2.4
1. S4 Accounting class has a total of 120 students. The
class teacher carried out a data survey to find out how
many students regularly eat meat, pork, chicken or fish athome. The data below in the below table was collected
a) Use the data given in the table above to create a clustered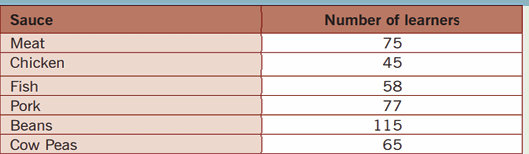
bar chart
b) On the chart created change the chart titles and Axis titles to
make them reflect the king of data they show.
2) Below are the data of old persons in 10 Rwanda Districts as
published on igihe.com in its article of 7th December 2018.Represent those data using Pie chart.
Activity 2.5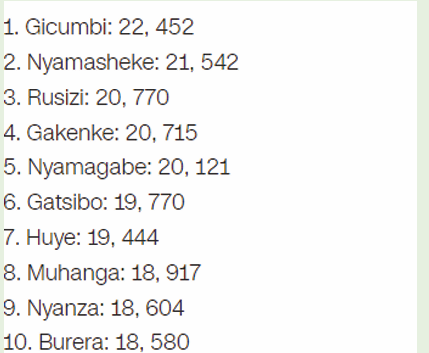
3) Observe the screenshot below taken from Word
a) What among those the options shown on that screen is used to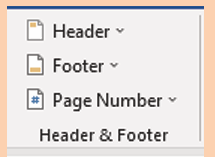
insert headers in a Word documentb) Differentiate the terms Header and Footer as used in a Word do-
cument
c) What is the importance of headers and footers in a document
A header is a section of the document that appears in the top margin, while
the footer is a section of the document that appears in the bottom margin.
Headers and footers generally contain additional information such as page
numbers, dates, an author’s name, and footnotes, which can help keep
longer documents organized and make them easier to read. Text entered in the
header or footer will appear on each page of the document.
2.5.1 Insert header and footer
To insert a header and footer in Ms word follow steps given below:
1. Click on the Insert tab at the top of the Ribbon
2. Click on either Header or Footer drop-down menu in the Header &Footer section.
3. A Header or Footer drop-down menu will display on the screen with a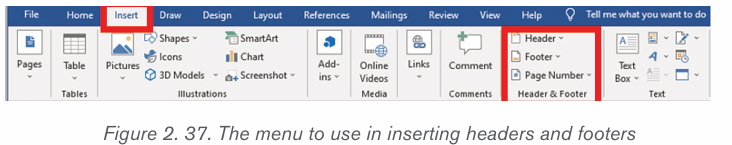
list of built-in Header or Footer options. Select your desired option fromthe Built-in list.
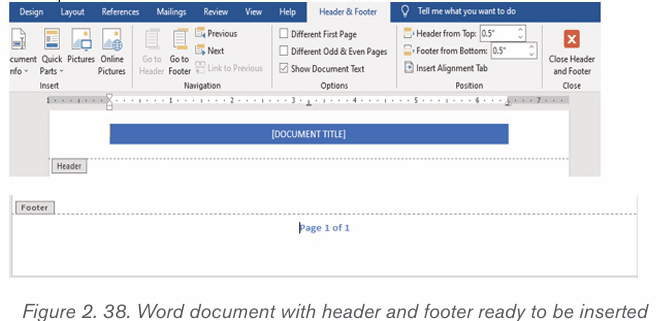
4. A Design tab with Header & Footer option will appear at the top of thedocument (on the Ribbon), as shown in the screenshot below.
2.5.2 Delete Header and Footer from Word document
Position the cursor within the header or footer and press the Delete button onthe keyboard or
1. Go to the Insert tab on the Ribbon and click on the Header & Footer option.
2. A Header or Footer dialog will appear on the screen. Click on the RemoveHeader or Remove Footer option.
2.5.3 Add page numbers to a document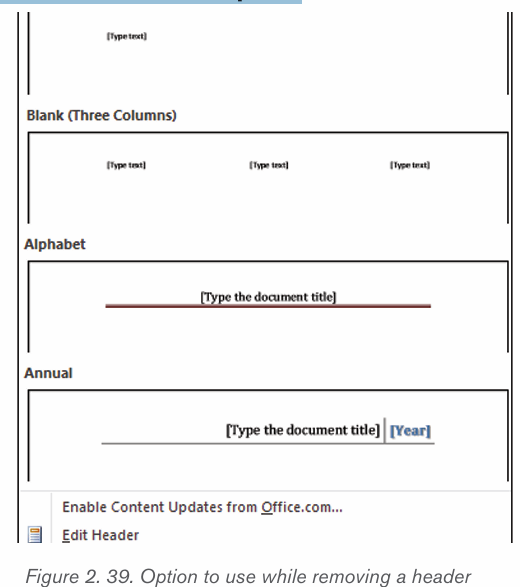
Follow the following steps to add page numbers to a Word document:
1. Click on Insert tab then on Page Numbering.
2. Select Current Position.3. Choose a page number style
Note: It is possible to have different formats of page numbers in one document.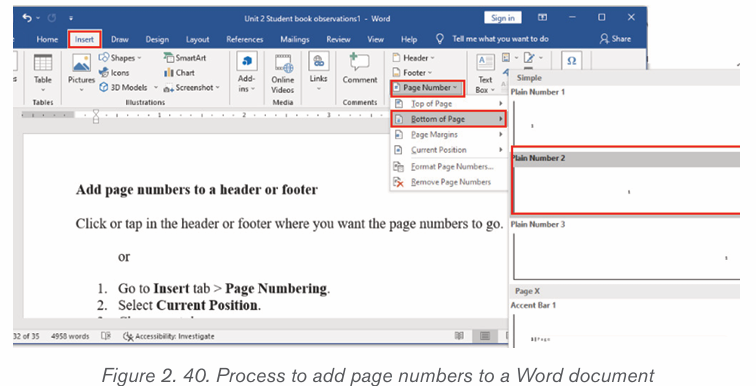
For example the first part of a document can have letter page numbers while
other pages are numbers. Inserting such page numbers is done by insertingsections from the place where the page number format changes.
Application activity 2.5
You have a document of at least 5 pages whose content is about your
everyday lessons
a) In that document insert a footer text “Lessons for Senior 4”
b) Insert page header text “Studying is the key in life”
c) By doing a research insert page numbers (in letters) i and ii in thefirst two pages and numbers from those pages
6.1Table of content
Activity 2.6
Using internet or other available resources Search and prepare a Word
document which describe computer hardware and software and save it
as “Information and Communication Technology”. Make sure the document
has at least 4 pages. Do the following with the created document:
1. Do the following with the created document:
2. Change the Font Type to “Book Antiqua”.
3. Change the Font Size to 12 and Line Spacing =”2.0”4. Change Heading 1 to “Arial Black” and Font-size =”14”
2.6.1. Steps to create a table of content
A table of content is a list titles which are inside a document with
the page number where they can those titles can be found. To create
a table of content when the document is done in two steps namelycreating headings and inserting the table of content.
• Creating headings
In a Word document, headings are titles of different weight which
have text under them. Word provides different levels of headings
starting from heading one which is the highest level in a document.
The created heading texts are the ones that will appear in the table of
content. Follow these steps to create a heading:
• Select the text and click on the Home tab• In the Style group Click on Heading 1 (or any other heading)
The heading is different in appearance to other text and to other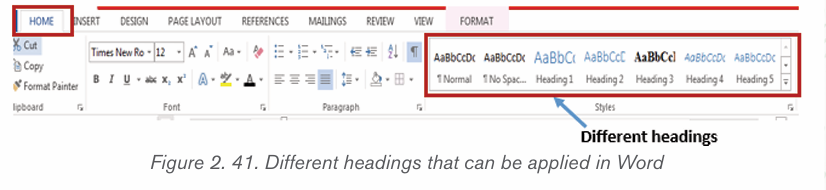
headings which are not at its level. The font that a heading will have
can be changed by:
• Do a right click on the heading to modify and click on Modify
• In the dialog box that appears, choose the new formatting to
apply on the heading.
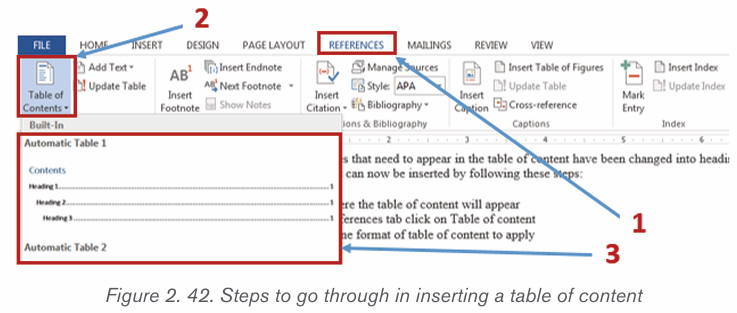
• Inserting a table of content
When all the titles that need to appear in the table of content have
been changed into headings, a table of content can now be inserted
by following these steps:
• Click where the table of content will appear
• In the References tab click on Table of content• Choose one format of table of content to apply
2.6.2 Updating the table of Content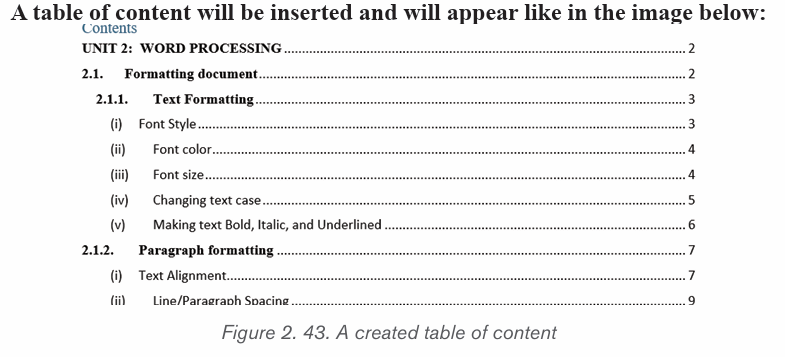
When some headings or titles were added or modified in a document, an update
of the table of content is needed.
Below are the steps to follow for making an update of table of contents.
Step 1: On the References tab, in the Table of Contents group, click Update
Table. Click “Update Table” button in the selected Table of Contents
Step 2: In the Update Table of Contents dialog box that displays, select “Updateentire table”. The new updated table of contents displays
2.6.3.Creating a list of tables and list of figures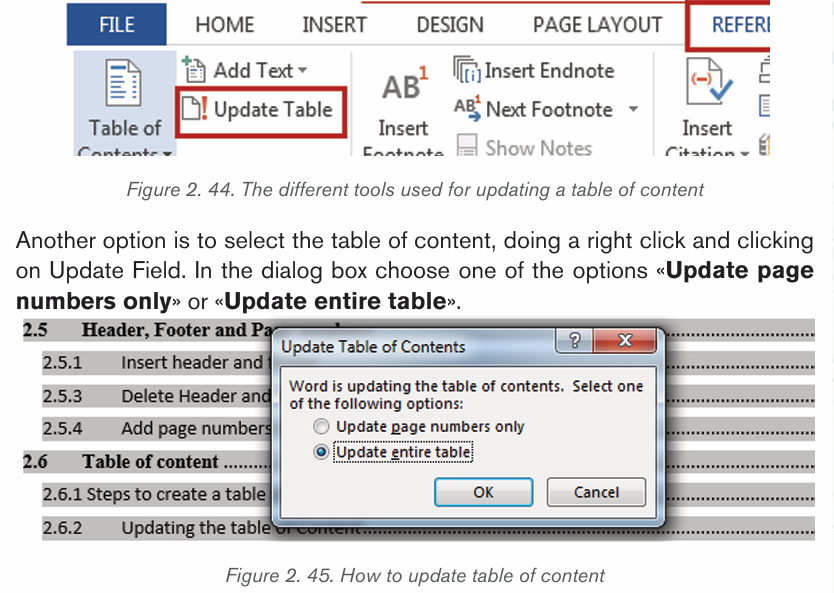
When creating a table of figures in a document, Microsoft Word searches for
the captions, sorts them by number, and displays them in that document.
Creating captions which will generate a table of figures is done in this way:
Step1: Add Captions to every Table in the document using procedure given
below:
1. First select a Table on which a caption is needed.2. Click “Insert Caption” command on References tab.
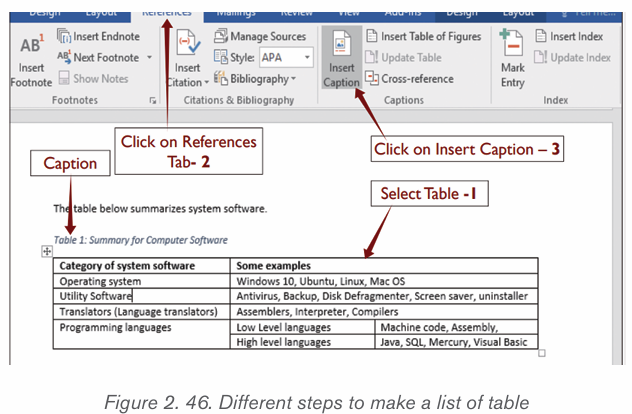
4. Repeat the procedure for all the tables in the document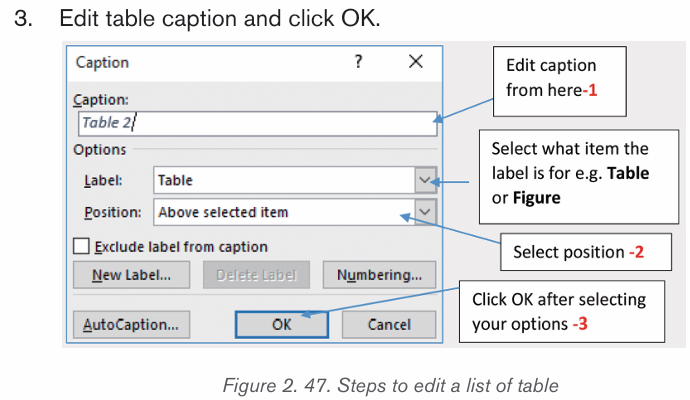
Step 2: Click where the Table of Figures will be inserted
Step 3: On References Tab in the Captions group, click on Insert Table of
Figures to build the table
A Table of figures dialog box will be displayed as shown in the picture belowand will automatically be inserted when the OK button is clicked.
Below are optional steps to take before clicking OK: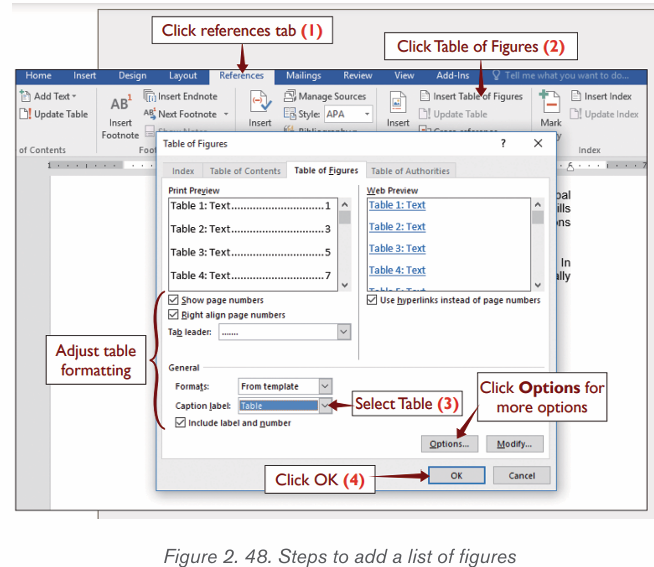
• Adjust Table’s formatting such as setting whether to show page
numbers or changing the style of tab leader. Use a preset style from
“Formats” drop down menu. In case you want to customize the style,
leave it set to “From Template”.
• Click “Modify” and click again “Modify” in the style dialog box to
customize the style of the table. You can change the table’s font, sizeand other settings in the two dialog boxes. Then c
Application activity 2.5
1. Create a document on ICT which has the following
headings:
Computer Hardware (Heading 1). Develop the content on
computer hardware by including the following these titles
which will be at the level of Heading 2:
• Input Hardware
• Output hardware
• Processing hardware
• Storage hardware
2. Create additional headings in Heading 2 where possible.
Those headings will be Heading and Heading 4
3. Add a new title “SOFTWARE” in the document. Make
that title a heading appropriately and in it create other
headings. Update your table of content.
4. Insert a table of content in your document basing on theheadings you have created
Skills Lab 1
Using Microsoft Word write a document about the profile of your school.
That profile should include the school’s background, current situation and
the plan for the future. Where possible include the pictures.
End of unit assessment 2
1. Use Microsoft Word, type the following document and save it as
‘Certificate of Appreciation form’. This document is a certificate andshould have a page border as shown below.
b) a) Use 1.5 line spacing for your work and no space after each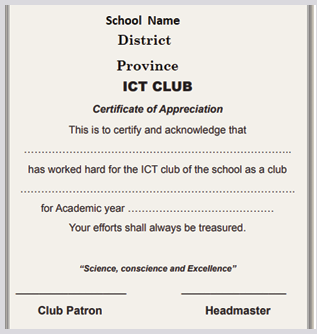
paragraph.
c) b) Make the following changes to the title:
iv) Change the font of the name of the school to Stencil bold font face,
font size 26 and dark blue colour.
v) Change the second line to font size 16 and bold
vi) Change the third line to font size 14 and bold.
a) Leave enough space between “Province Name” and ICT Club to
accommodate a suitable graphic (good image) that will work like
your school badge
b) Underline the heading, “Certificate of Appreciation” change it to
size 20 and color dark red.
c) Use blue font color for signatories in font size 15.
d) Apply dark red color to page border.
7. 2) When a new student of senior one come to GS Karama, the
below stages must be applied:
• Take a picture(Passport photo)
• Present the bank sleep to school accountant• Get registration number(Reg Num)
End of unit assessment 2
According to the above mentioned information, present that process using
Smart Art object
– Take school uniforms
– Go to classroom(S1) where the taken Reg Num is belong
– According to the Reg Num, search and find the correspondence seat
in dining hall and bed in dorm.
1. Use Microsoft Word, type the following document and save it as
‘Certificate of Appreciation form’. This document is a certificate andshould have a page border as shown below.
b) a) Use 1.5 line spacing for your work and no space after each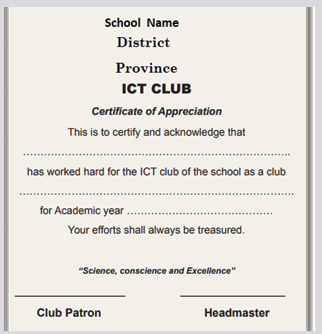
paragraph.
c) b) Make the following changes to the title:
iv) Change the font of the name of the school to Stencil bold font face, font
size 26 and dark blue colour.
v) Change the second line to font size 16 and bold
vi) Change the third line to font size 14 and bold.
a) Leave enough space between “Province Name” and ICT Club to
accommodate a suitable graphic (good image) that will work like your
school badge
b) Underline the heading, “Certificate of Appreciation” change it to size
20 and color dark red.
c) Use blue font color for signatories in font size 15.d) Apply dark red color to page border.
End of unit assessment 2
1. 2) When a new student of senior one come to GS Karama, the
below stages must be applied:
• Take a picture(Passport photo)
• Present the bank sleep to school accountant
• Get registration number(Reg Num)
According to the above mentioned information, present that process using
Smart Art objects-
Take school uniforms- -
Go to classroom(S1) where the taken Reg Num is belong
According to the Reg Num, search and find the correspondence seatin dining hall and bed in dorm.
UNIT 3 :MICROSOFT EXCEL
Introductory activity
Create the following table in a spreadsheet:
i) Apply borders as done with the table above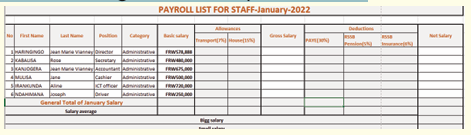
ii) Enter all data as provided in the table above
iii) Calculate staff allowances, Gross salary, deductions and Netsalary
iv) Using SUM, AVERAGE, MAX and MIN, calculate the General
total of January Salary, Salary average, the staff who gain a bigsalary and the one who get less salary than others.
3.1 Worksheet and workbooks basics
Activity 3.1
1. Compare a worksheet and a workbook
2. Outline 5 features of Ms excel
3. Using internet search and discuss the following:
• Amortization of a loan
• Different steps of creating a loan amortization schedule
Microsoft Excel is one of the spreadsheet programs that helps to store and
represent data in a tabular form, manage and manipulate data, create optically
logical charts, and more.
To open Microsoft Excel, click on the Start button and search for the MS Excel
application. Double click on the Excel icon to open the Excel. When Excel opens,an interface will appear.
3.1.1. Introduction on workbooks and worksheets
A workbook is a collection of many sheets. A worksheet is made of rows and
columns that intersect each other to form cells where data is entered. In Excel
worksheet, rows are represented by numbers and columns by alphabets.
A single Excel workbook can consist of several sheets, named Sheet1, Sheet2,
Sheet3, etc. One or more sheets can be added to an Excel workbook. Byclicking to the Plus (+) sign next to a worksheet name.
A. Opening an existing workbook
An existing Excel file (workbook) is opened in the same way as other files. First
know where it is located and open the folders where it is stored. When reached
double click it.
An existing file can also be opened from an opened Excel file. To do it do thefollowing:
In addition to creating a new workbook. An existing workbook may contain data.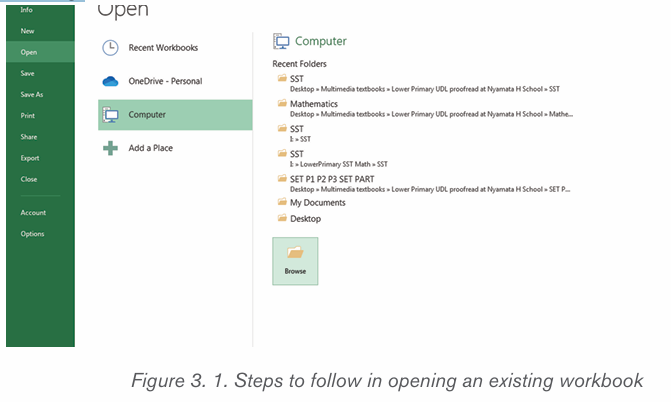
It can be opened directly from the location where it is stored or through MSExcel. Follow the given steps below:
B. Worksheet environment
A worksheet consists of many rows and colums and other tools that are used
to carry out different operations. When using a worksheet, the user has also to
be aware of the different views possible which will rule how the worksheet will
appear. There are three main views namely Normal View, Page Layout View
and Page Break View.
The different views are accesses by clicking to their respective icons which arelocated in a worksheet near the bottom left corner.
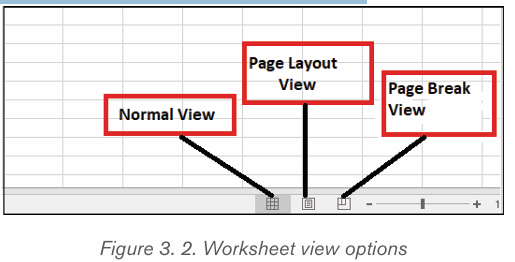
A worksheet contains different tools which are shown below:
3.1.2. Operations on a worksheet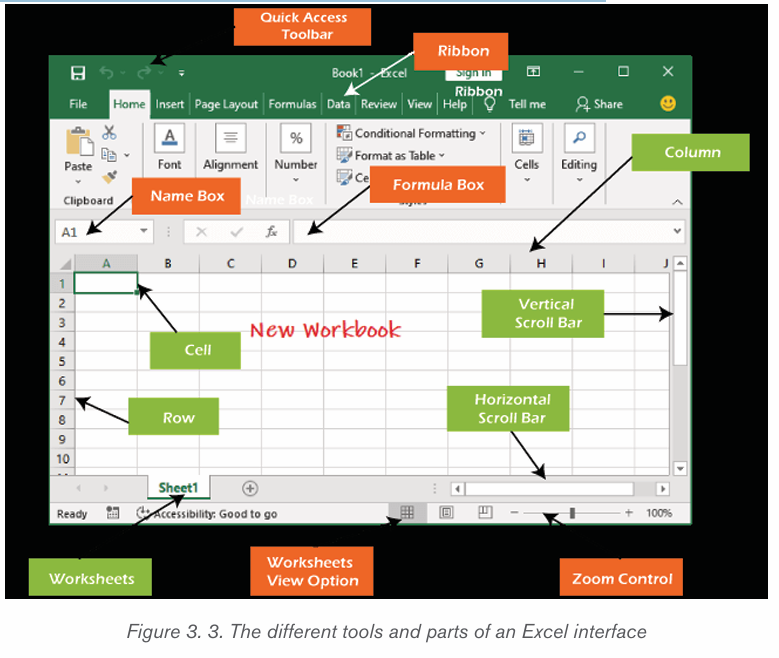
Excel enables the users to perform several types of operations on Excel
worksheet and its data. For example, Rename a worksheet, insert a new
worksheet, delete a worksheet, and many more.
A. To rename a worksheet
A new worksheet named Sheet1 gets added to the workbook by default. Excel
allows its users to rename the worksheet name. A worksheet is renamed in
order to reflect its content. Follow these steps to rename a worksheet:
1. Right-click on the worksheet to be renamed, then select Rename fromthe worksheet menu.
2. Type the desired name for the worksheet. In this case «januar» has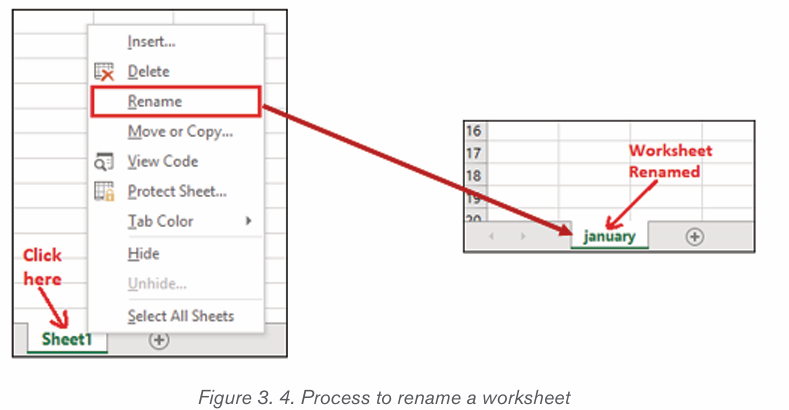
been written
3.Click anywhere outside of the worksheets, or press the Enteron our keyboard.
The worksheet will be renamed.
B. To create a new worksheet
Excel provides a new sheet button (+ symbol) near the different worksheet
names that allow the users to add any number of worksheets to their currently
active workbook. To create a new worksheet click on that Plus button a newworksheet is immediately created
C. To delete a worksheet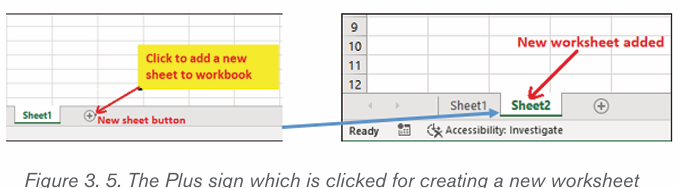
1. Right-click on the worksheet to be removed then select Delete fromthe worksheet menu.
3.1.3. Loan amortization worksheet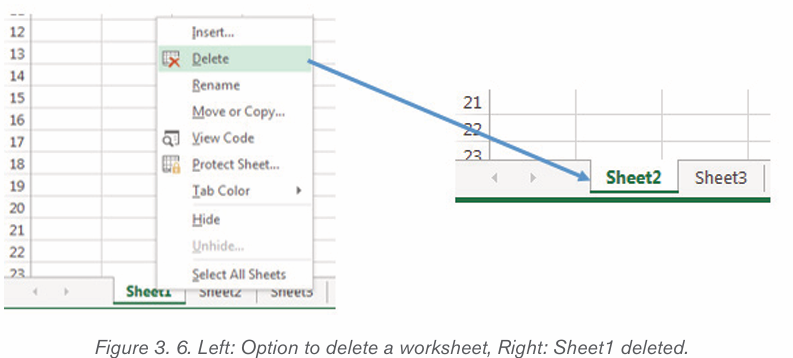
Loan amortization is the process of scheduling out a fixed-rate loan into equal
payments. A portion of each installment covers interest and the remainingportion goes towards the loan principal.
In banking and finance, an amortizing loan is a loan where the principal of the
loan is paid down over the life of the loan according to an amortization schedule,typically through equal payments.
Creation of loan amortization worksheet
In order to create an amortization of a given loan follow these steps :
1. Select the worksheet on which a loan amortization can be calculated.
2. Right click on the selected worksheet and click on Insert
3. Click on Spreadsheet solutions on the insert window
4. The select Loan Amortization5. Then click Ok
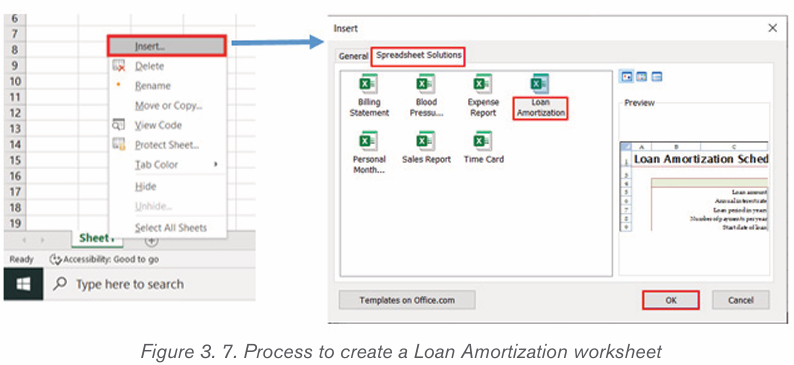
The loan amortization worksheet will appear like in the window below
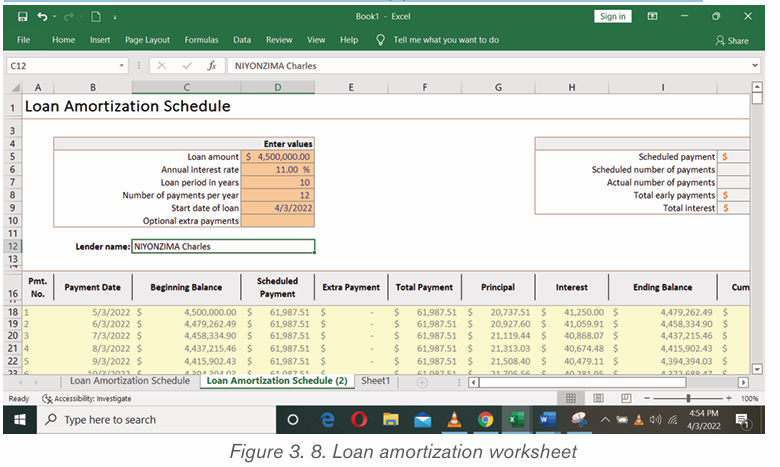
Application activity 3.1
1. UMURAZA Febronie is a secondary teacher at G.S. MUHAMBARA,
she went to UMWALIMU SACCO to request for a salary advance
loan of 2000000 Rwf to be payed in three years (36 months) . As
a loan officer, create a loan Amortization schedule for that teacher.
2. Explain how you can :
a) Add new worksheet
b) Delete a worksheetc) Rename a worksheet
3.2. Cells basics
Activity 3.3
1. Given the following table created in a Excel:
a) a. Using cells references, calculate the Total Price for each item and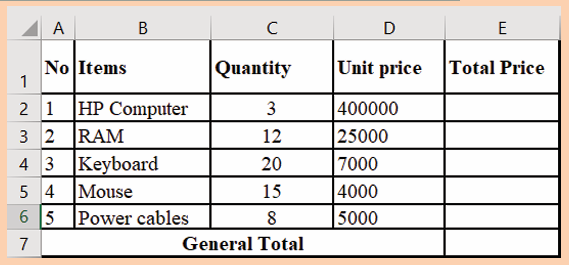
b) b. The General Total
3.3.1 Cell references
There are three types of references in Excel namely relative cell references,
absolute cell references and mixed cell references in Excel
0. Relative Cell References
By default, all cell references are relative references. Relative references are
changed when copied across different cells based on the relative positions of
rows and columns. For example, suppose this formula =B1*C1 is to be copied
from row 1 to row 2, the formula will become =B2*C2. Relative reference isuseful when it requires to repeat a calculation across numerous rows or columns.
1. Absolute Cell References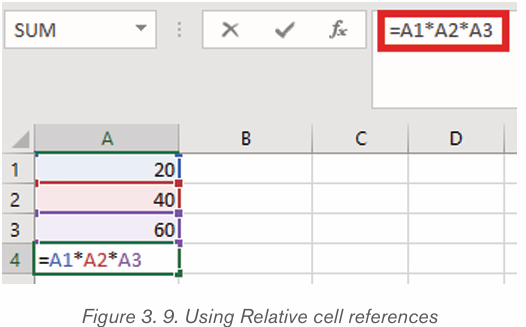
Absolute cell reference is one in which the cell references being referred to do
not change like they did in a relative reference. To set an absolute cell reference
use the $ sign by pressing f4 to create a formula for absolute referencing. The $
sign means lock, and it locks the cell reference for all of the formulas, ensuring
that the same cell is referred to all of them. To use a formula with absolute cell
reference use the $ (dollar sign) in front of every cell.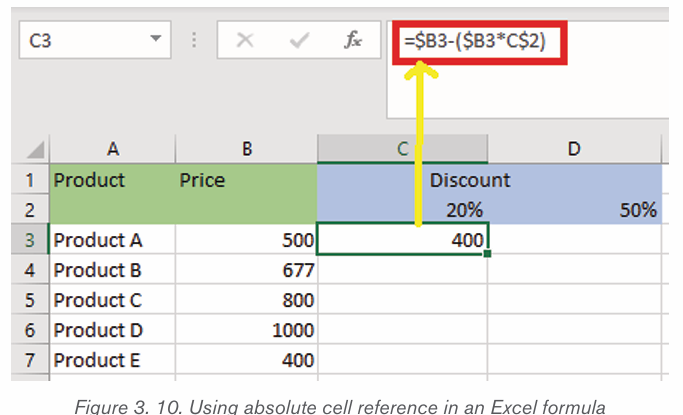
2. Mixed Cell Reference in Excel
A Mixed cell reference is a mixture of both relative and absolute cell reference. In
mixed cell reference, dollar signs are attached to either the letter or the number.
For example, $B2 or B$4. It’s a mix of relative as well as absolute reference.
There are two types of mixed cell references:
1. The row is locked while the column changes when the formula is copied.
2. The column is locked while the column changes when the formula iscopied.
3.3.2 Text Alignment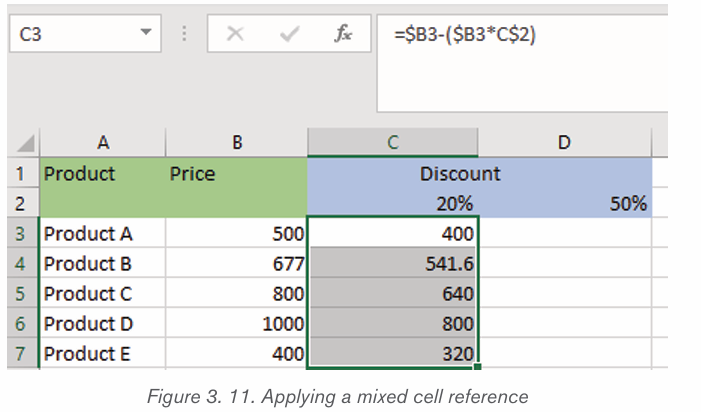
Text alignment is a feature that helps users to align text within worksheet cells.
It enables the composition of text documents with various text positions or
alignments on one or more cells within the Excel document.
a. Change Text Alignments from Ribbon
The easiest and straightforward way to access text alignment options in
Excel is to use ribbon tools. Both horizontal and vertical alignment options
can be accessed by going to the Home tab and using the alignments fromthe Alignment group.
By default, Excel automatically aligns entered text contents to the left position of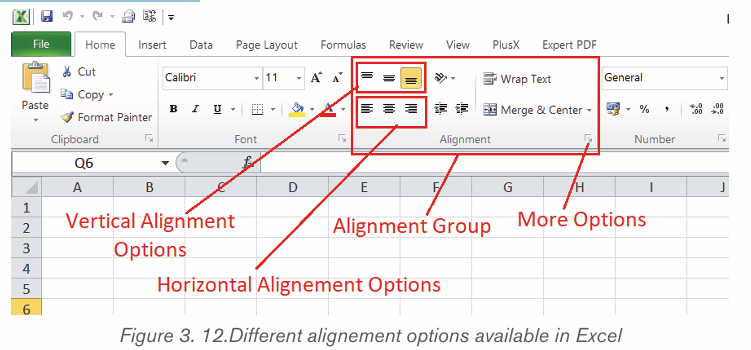
the cell and numbers to the right position. Alignment options from the Alignment
group can be used to change the alignment accordingly.
Follow these steps to align a text:
• Select the text to be aligned
• Click the tool to be used from the vertical alignment options and pick
Top Align, Middle Align, or Bottom Align, respectively.
• Click the tools from the horizontal alignment options and pick Left Align,
Center Align, or Right Align, respectively.
a) Change Text Alignments from Format Cells
The Format Cells dialog box is another efficient way to change text alignments
in Excel cells. Perform the following steps to use this method:
• First, select the cells on which to align texts.
• Open a Format Cells dialogue box and launch a dialogue box by
clicking the arrow at the bottom right corner of the Alignment group
under the Home tab.
• In the new dialog box that appears click on Alignment
• Select the different types of alignment to be applied. If the text orientation
needs to be changed change it using the Orientation option which is
set by moving the needle or setting the text orientation degrees.• Click on OK to apply the new text alignment
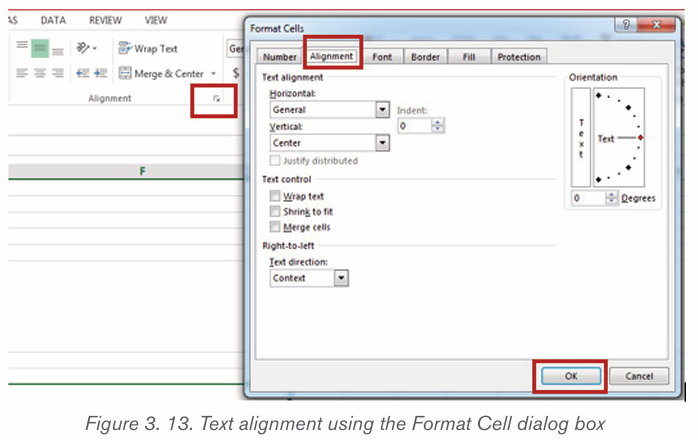
Alternately, pressing Ctrl+1 the keyboard shortcut keys combination can open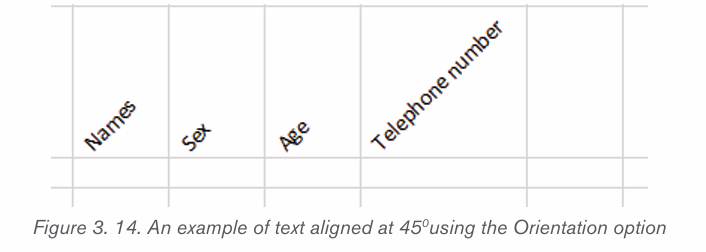
the Format Cells dialogue box.
3.3.3 Setting Font
Excel has a variety of built-in customizations that can help to change the
appearance of the sheet to a maximum extent. The font properties that can be
changed are: font type, font size, font color, and changing the text to bold, Italc
and Undelining the text. The font can be changed using the menu Ribbon orusing the Format Cells dialog box.
• Changing Font Type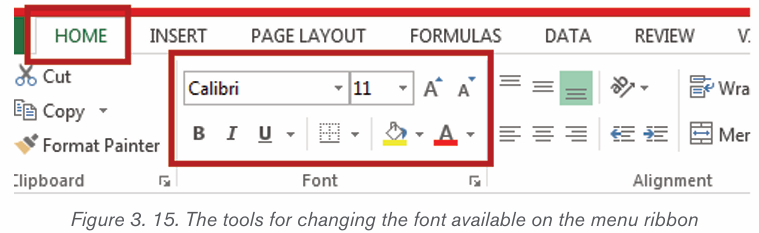
To change the font type or style using the menu ribbon in one or more Excel
cells, perform the following steps:
• Select the cell (s) consisting of the needed values to format.
• Next, go to the Home tab and click the initial drop-down list under thecategory font, as shown below :
• We can scroll down to view all the installed fonts on computer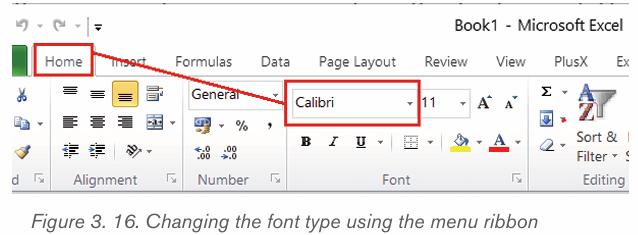
clickon
the desired font type/style to instantly use it in the selected cell (s).
• Changing Font Size
To change the font size in the desired Excel cells, perform the following steps:
• Select the cells to adjust font size.
• Go to the Home tab and click on the drop-down list associated with
the number (i.e., 11, 12, etc.), next to the Font drop-down list, underthe Category Fonts, as shown below:
There is a selection of multiple pre-defined font sizes to choose from. to use the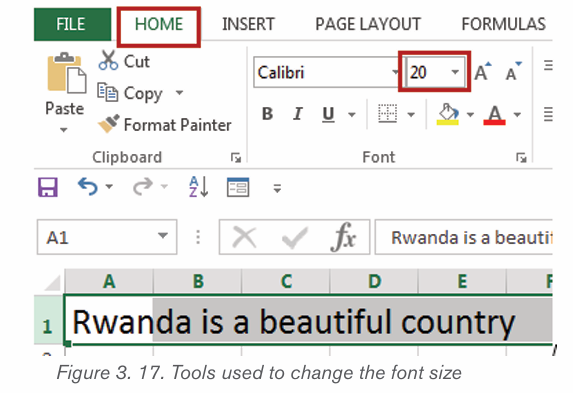
desired font size, click the number from the list. However, if there is no suitable
size, type the number directly in the font size box and press the Enter key.
The font size can be quickly adjusted by clicking on Increase Font Size andDecrease Font size tools, displayed next to the Font size box.
• Changing Font Color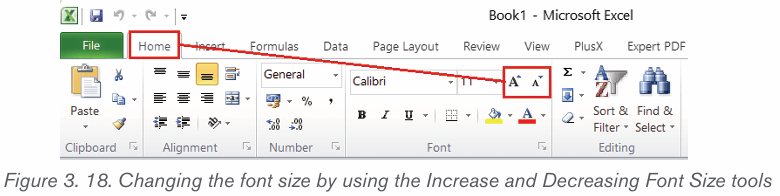
To change the font color for the desired Excel cells, perform the following steps:
• Select Excel cells to apply the desired color.
• Next, navigate the Home tab and click the last drop-down list under
the category Font. It is associated with the letter ‹A› and a red color barbelow it. Refer to the screenshot below:
• After clicking the drop-down arrow for the font color, click on the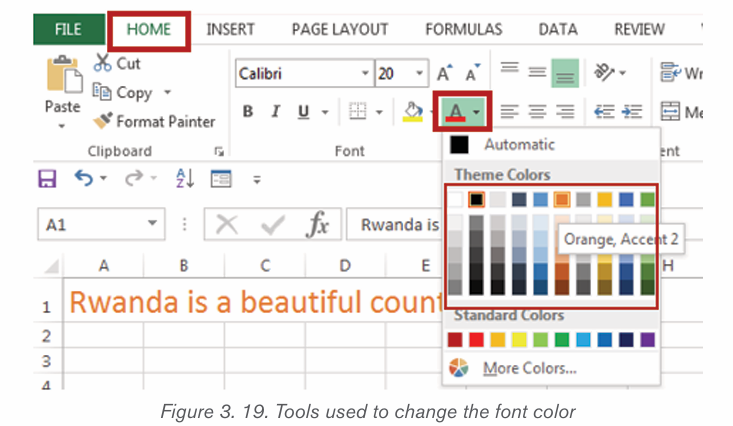
desired color from the list of Theme Colors or the Standard Colors.
In this case the red color was clicked.
Note: If the cell is empty while setting the font in Excel, then as soon as we start
typing text or data in the respective cell, the applied style, size, color, etc., will
be applied automatically.
• Setting Font to use Bold, Italic, and Underline
To change the font format in the desired Excel cell to make it bold, italic, or
underlined, perform the following steps:
• Select one or more Excel cells to modify their respective values.
• Go to the Home tab and click the Bold (B), Italic (I), or Underline
(U) shortcut under the category Font. These tools help to change the
appearance of the selected cell accordingly. Now the text becomesmore black, underlined and oblique (italic)
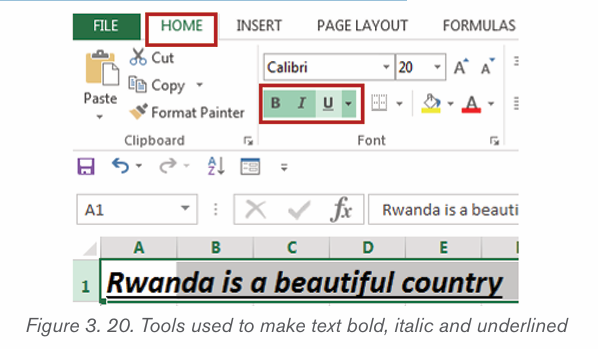
Application activity 3.2
1. Discuss the different ways of text alignment
2. Using the data of an Activity 3.2, apply the follwing :
a. Align on top the first row
b. Make all items centered
c. Make the Total Price centered to the right side and make it be in
a red color
d. Make the font size of General Total be 18
e. The font style should be Tahoma, Bold and Italic
f. Fill the whole table with green color
3.3 Arithmetic operators in formula
Activity 3.3
1. What do you understand by an operator ?
2. Give two examples of arithmetic operators and its uses
In mathematics, the term operator refers to a sign or symbol used to evaluatemathematical operation.
The most basic mathematical signs are the arithmetic operators which includeaddition (+), subtraction (-), multiplication (×), and division (÷).
In mathematical computing, the same operators are used but multiplication and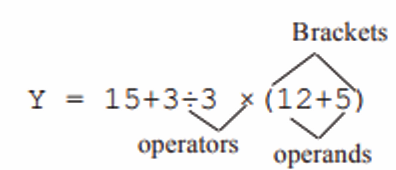
division operators are replaced with asterisk (*) and forward slash (/) respectively.
The table below, gives a summary of the four arithmetic operators supported inExcel and their functions :
3.3.1 Addition operator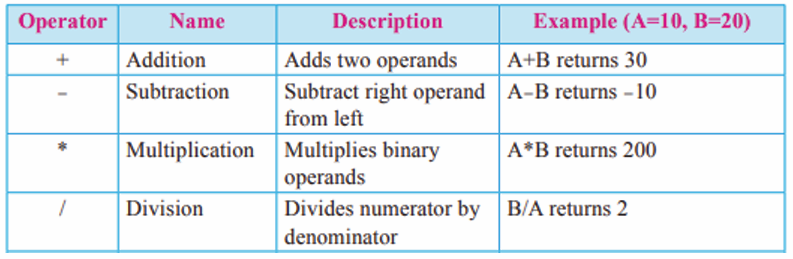
The addition operator (+) evaluates mathematical addition operation
Example: The figure below represents data of students ‘performance in threesubjects. Find the total marks for every student
To complete the total column, consider the below steps: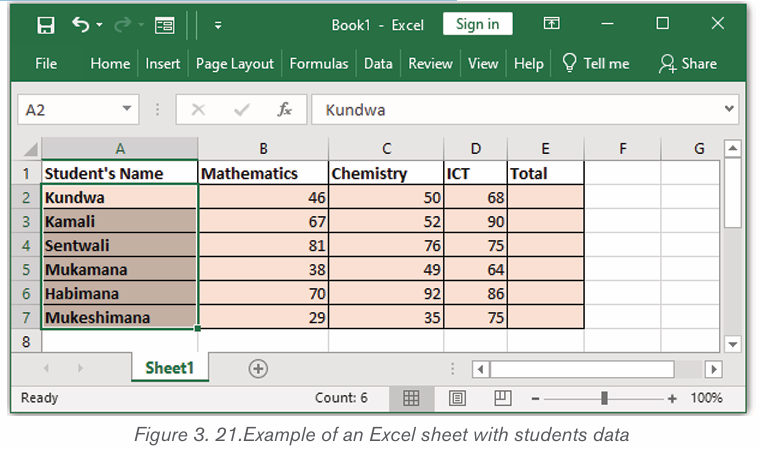
a. Click on the first cell of the total column.
b. Drag the mouse on the formula bar and type =B2+C2+D2
c. Click on the bottom-right corner of that block and drag to the last cell of
the total column.
d. And release the mouse, the result will appear on all the specified cells ofthe column as it is shown below:
3.3.2 Subtraction operator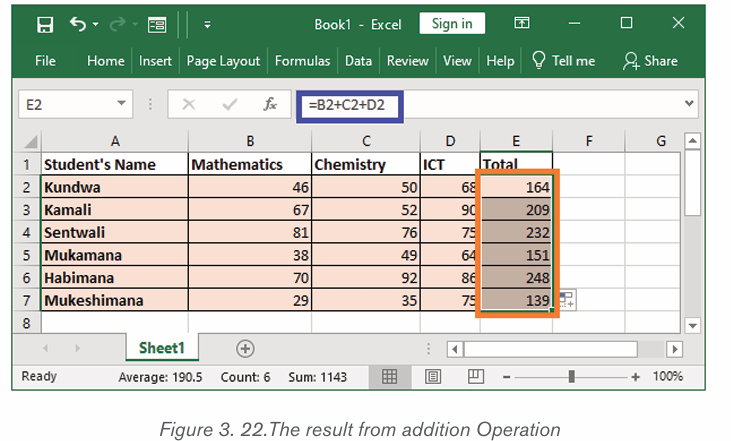
The subtraction operator (-) evaluates mathematical subtraction operation
Example: Using data stated in example above, Calculate the difference between
Mathematics marks for Kundwa and Kamali.
Perform the following steps:
a.Click on the cell where the difference/resultat will appear.
b.. Write in cell the Substraction formulas =B3-B2
c. click on enter button, the result will come in cell as it is shown bellow: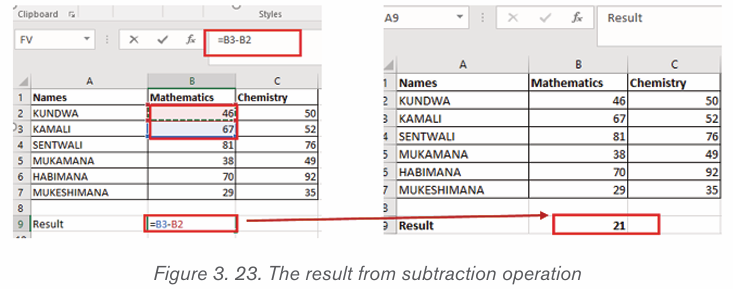
3.3.3 Multiplication operator (*)
The product of numeric values is performed by using a multiplication operator
in formulas. Let’s use the example of purchasing different products, where the
total price as product will be obtained by multiplying quantity with price per unit
Here below, are the steps to be followed:
a. Click on the first cell of the Product column.
b. Drag the mouse on the formula bar and type =B2*C2
c. Click on the bottom-right corner of that block and drag to the last cell of
the Product columnd. Release the mouse Button, to see the result as follows :
The division operator is used in calculation of quotient of two numeric values.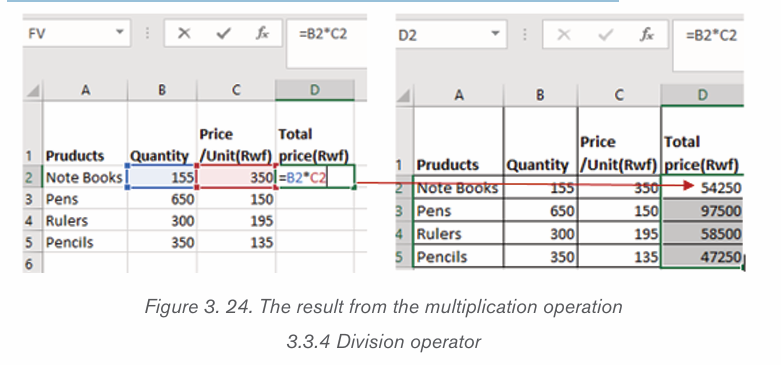
Use the same data of additional operator in order to understand how division
operator works.
For example, let divide total marks for Sentwali by 2. Proceed as follows:
a. Select F4 cell of the Quotient column.
b. Drag the mouse on the formula bar and type =E4/2
c. Press Enter key to find the result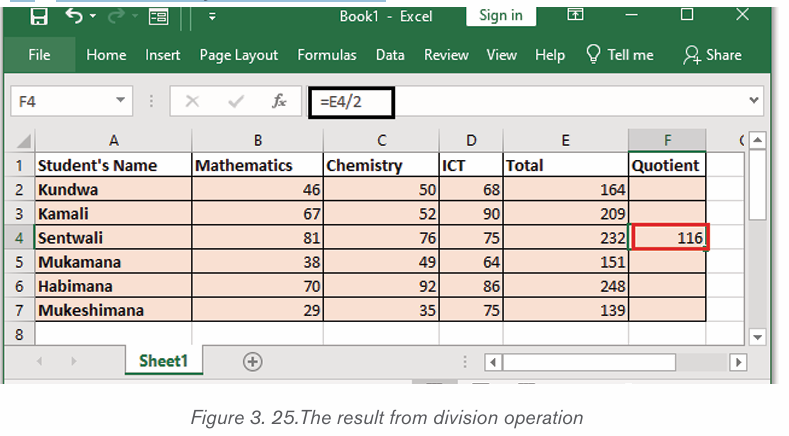
Application activity 3.3
1. Study the figure given below that presents the national examinationresult of 4 primary students and wok out the related questions
a) Calculate the total marks for all given students. Total marks will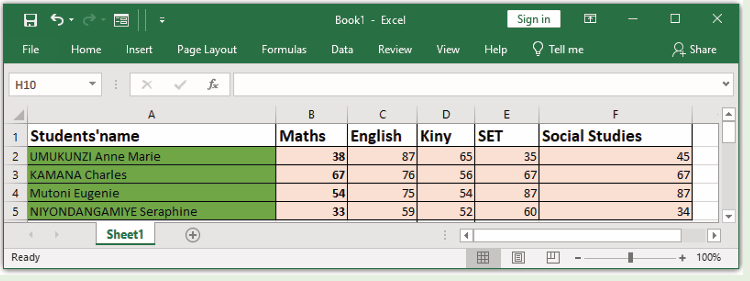
appear in G column
b) Calculate the difference between the marks of UMUKUNZI and MUTONI
c) The marks of mentioned students are on 100 for each subject.
You are requested to put their total marks on 100. The result will
appear in H column.
d) For each student, add 2marks on her/his percentage of marks
e) For student named NIYONDANGAMIYE, add 3marks to each subject
3.4. The use of functions
Activity 3.4
After doing a research on internet or any other resource:
a. Identify different parts of a function
b. Explain different types of functions available inExcel.
3.5.1 The parts of a function
In order to work correctly, a function must be written in a specific way. The
basic syntax for a function is the equals sign (=) followed by the function
name (SUM, for example), and one or more arguments. Arguments contain
they are numbers or any other data on which the function operations are going
to be done. The arguments of a function can be written in two ways:
• Writing every single argument in a function. This option is used when
the arguments to be added are not many.
• Writing the range starting from the first argument to the last argument.
This is possible only if the cells (arguments) are in the same row or inthe same column.
Arguments can refer to both individual cells and cell ranges and must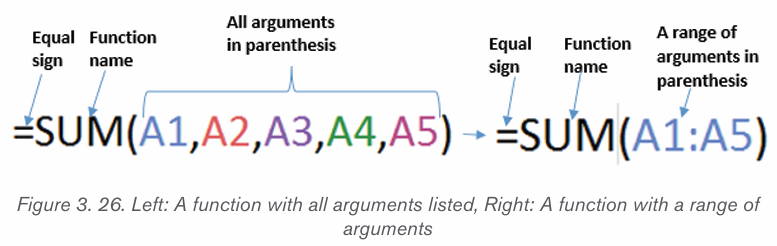
be enclosed within parentheses. You can include one argument or multiple
arguments.
3.5.2 Excel Aggregate functionsA SUM function
The sum SUM function is used to add numbers. It can add two or more arguments
which are all enclosed in parenthesis or just a range of arguments starting from
the first cell and ending by the last cell. In the first case, cells (arguments) are
separated by comma (,) while for the second case the first and last cell areseparated by a colon (
For example the function =SUM(A2,B2,C2,D2,E2) will add the values of in the.
cells A2,B2,C2,D2 which are in the same row. This same function canbe written as =SUM(A2:E2).
To use the SUM function and get addition results like in the screenshot above,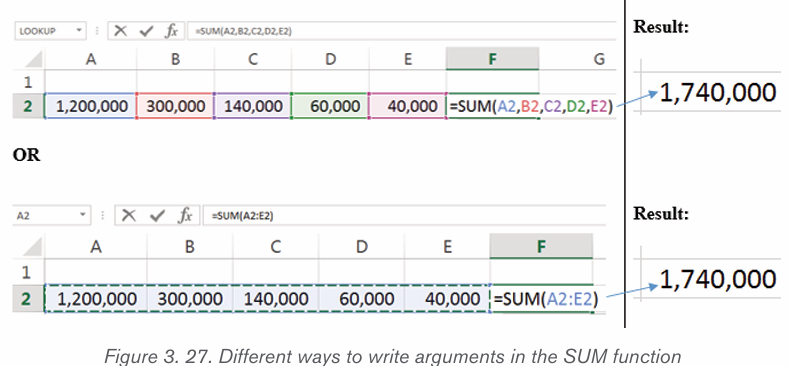
do the following:
• Put the cursor in the cell where the sum will be calculated and write an
Equal sign (=)
• Write the word SUMand put the cursor inside the parentheses
• If all the cells (arguments) will appear in the parentheses, click on every
call and write a comma after every cell. If only the first cell and the last
will appear in the parentheses just select all the cells whose content is
to be added
• Click outside the cells for the sum to be calculated
When the data to be added is not in the same row or the same column,
the two ways of writing arguments can be used. For example, the function
=SUM(A1:A3,C1:C2,E1) will add the values of all of the cells A1 to A3 then C1to C2 and E1. This same function can be written as =SUM(A1,A2,A3,C1,C2,E1)
The AutoSum command allows you to automatically use the most common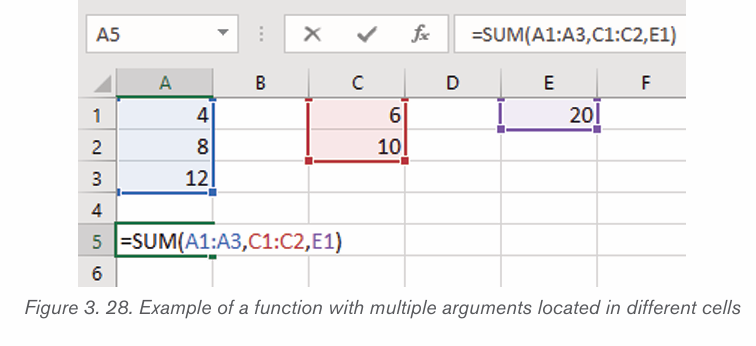
functions including SUM, AVERAGE, COUNT, MIN, and MAX. In the example
below, the SUM function is accesses by using the AutoSum command. The
AutoSum command is available under the Formula tab. It can also be accessed
under the Home tab in the Editing group.
1. Select the cell that will contain the function.
2. In the Editing group on the Home tab, click the arrow next to
the AutoSum command. Next, choose the desired function from thedrop-down menu. In this example Sum was selected.
1. Excel will place the function in the cell and automatically select a cell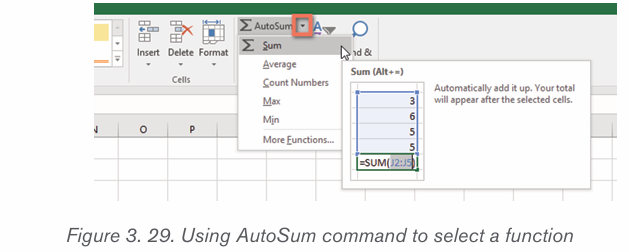
range for the argument. In this example, cells D2:D7 were selected
automatically; their values will be added to calculate the total cost. If
Excel selects the wrong cell range, you can manually enter the desired
cells into the argument.
2. Press Enter on your keyboard. The function will be calculated, andthe result will appear in the cell.
B. AVERAGE function
The average function determines the average of the values included in the
argument. It calculates the sum of the cells and then divides that value by the
number of cells in the argument.
Its syntax if all the arguments will appear in the parentheses is:=AVERAGE(number1, number2,…)
A syntax containing only the first and last cell between the parenteses can alsobe use.
For example, the function =AVERAGE(F1,F2,F3,F4) would calculate
the average of the values in the cells F1, F2, F3 and F4. This same functioncan also be written as =AVERAGE(F1:F4)
To calculate the average using the AVERAGE function as it was done in the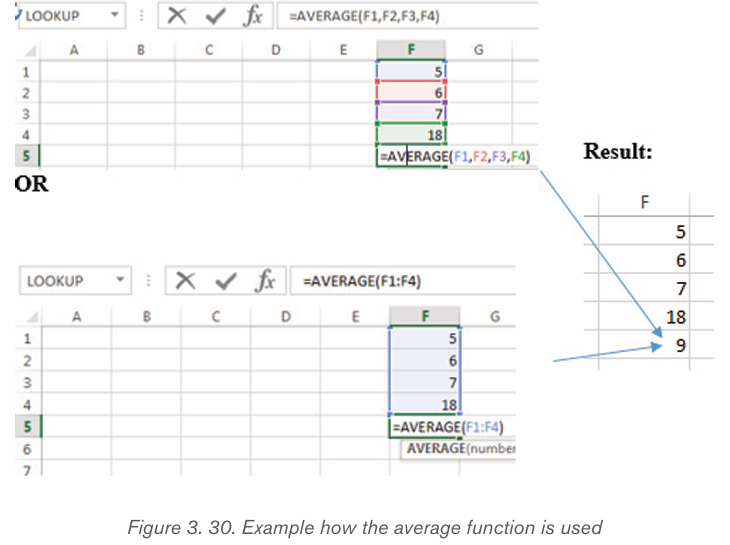
screenshot above, do the following:
3. Select the cell that will contain the function result.
4. Type the equals sign (=), and write the function name which is
AVERAGE. You can also select the desired function from the list
of suggested functions that appears below the cell as you type.
5. Enter the cell range for the argument inside parentheses. In this
example type (F1:F4) or type (F1,F2,F3,F4) or just select those cells.
Press Enter on the keyboard or click in any other cell.
C MIN function
The Excel MIN function returns the smallest numeric value in the data provided.
The MIN function ignores empty cells, the logical values TRUE and FALSE, and
text values.
The syntax of the MIN function is:=MIN(number,number2, …)
This syntax can also be written in such a way that only the first argument (cell)
and the last appear in the parentheses. In this case, the two cells are separatedby colon (
Example: =MIN(A1,A2,A3,A4) OR =MIN(A1:A4)
To use the MIN function proceed in this way:
• Go in the cell where the min will be calculated
• Write the Equal sign followed by MIN
• In the parenteses write the arguments or select them. In this case the
argments are C1, C2, C3 and C4.• Hit the Enter key or click in any other cell for the result to be calculated
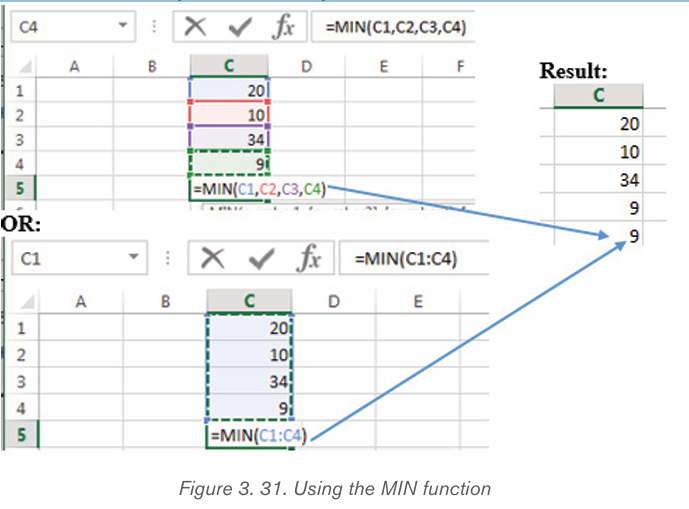
D MAX function
The MAX function returns the largest numeric value in the data provided. For
example, MAX function can return the highest marks for a student for all subjectsor the highest mark for a student for a given subject.
The syntax of the MAX function is:
=MAX(number1,number2,…)
The arguments in the parentheses can be only the starting cell (argument) and
the last cell separated by a colon.To use the MAX formula in Spreadsheet follow these steps:
6. In a cell where the maximum value will appear, type =MAX
7. Inside the parentheses write the cells for which the maximum number is
to be calculated or select those cells8. Press the Enter key or click in any other cell.
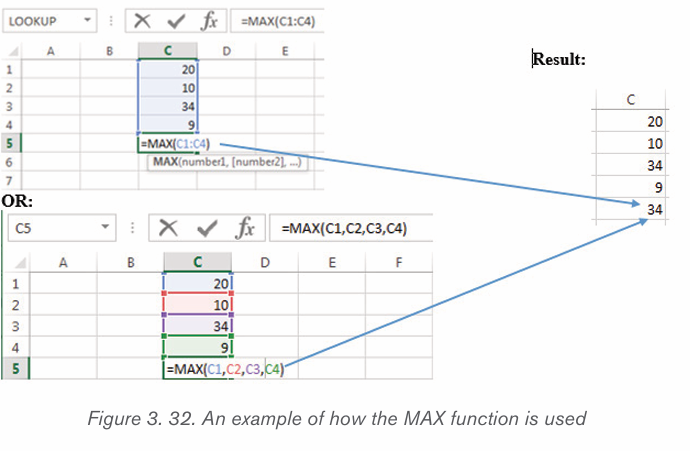
E. COUNT function
The COUNT function counts the number of cells with numerical data in the
argument. This function is useful for quickly counting items in a cell range. For
example, you can enter the following formula to count the numbers in the range
A1:A20
The syntax of the COUNT function is:
=COUNT(value1,value2,…)
However there is no need to put in the parentheses all the arguments if the cells
whose values are to be counted are in the same row or column.
Use the COUNT function in the following way:
• Click in the the cell where the count value will appear and type
=COUNT
• Inside the parentheses write the cells that will be counted
• Press the Enter key or click in any other cell.
Note that the COUNT function does not consider cells with content other thatnumbers. It does not consider text or empty cells.
Note that in the second screenshot the result of the COUNT function is 4 instead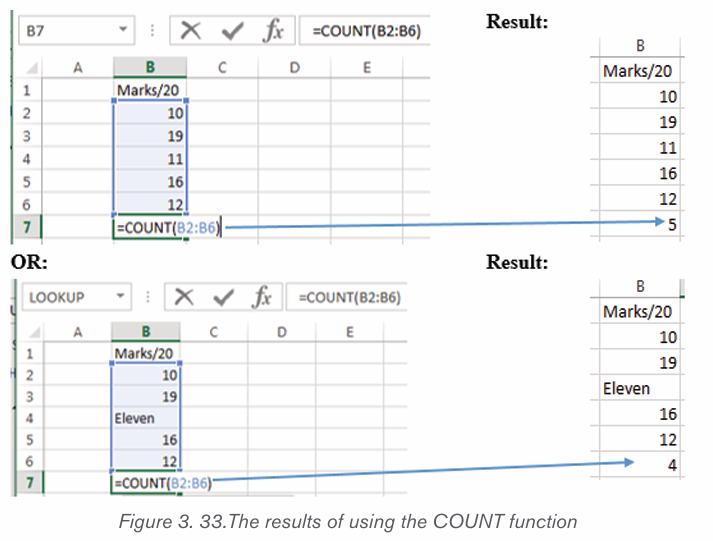
of being 5. This is because this function does not count cells containing text.
Application activity 3.5
Types the following and then calculate the total price, general total, average,minimum and maximum using spreadsheet functions
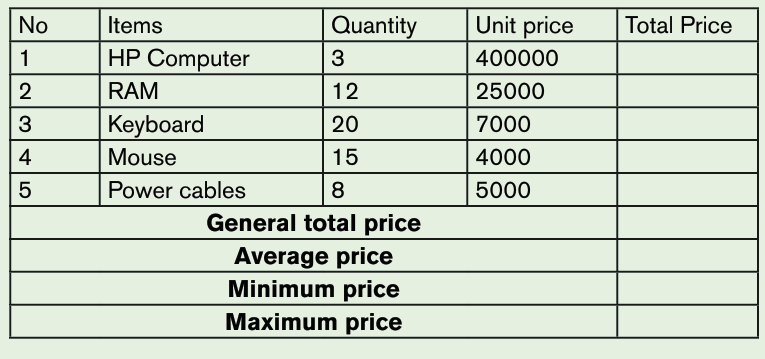
3.5. Tables and borders design
Activity 3.5
a) What do you understand by table borders?
b) With internet search ,
c) 1) Explain the importance's of using tables bordersd) Discuss different steps of applying borders
In Excel, borders refer to a line drawn across any or all of four sides of a cell in
a worksheet. When adding a border to one or more cells, choose specific sides
to include or exclude. Moreover, borders for custom or desired sides of cells
can be drawn manually.
• Applying borders from ribbon
Excel Ribbon is the primary area for accessing most existing commands or tools.
While creating a border in Excel, we can take advantage of the Excel ribbon and
apply a border to the desired cell using the following steps:
• Select the Excel cells on which to apply borders. Hold down the
mouse›s left button and drag the selected shading from one cell to the
others. When selecting non-adjacent cells in Excel, click on individual
cells while holding down the Ctrl key.
• Go to the Home tab on the ribbon and click on the drop-down icon
next to Border
• Click on the desired border style to apply it. Here All Borders wasselected.
Although there are many existing border options, sometimes, borders can be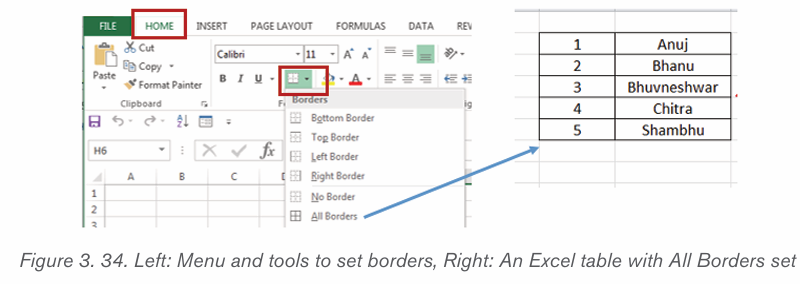
drawn using the Draw Border option from the drop-down list. This option is
accesses after clicking on Home then on the Border tool found in the Font
group. One can also use the Draw Border Grid which create a table over thecells moves on.
A border can be applied using the Format Cells dialog box. Go through the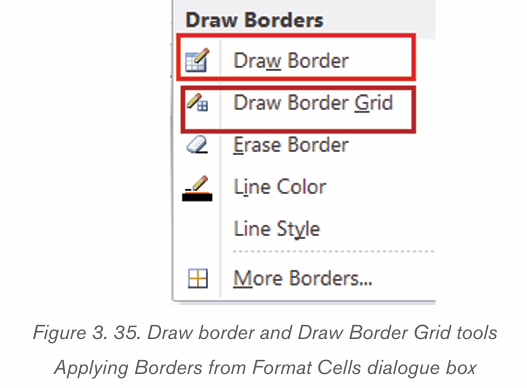
following steps to access the Format Cells dialog box and insert a border in
the desired Excel cell:
• Select the cells in the worksheet.
• Launch the Format Cells dialogue box by doing a Right click then
choose Format Cells• In the Format Cells dialog box that appears click on Borders
• Click on the different border styles to apply then click OK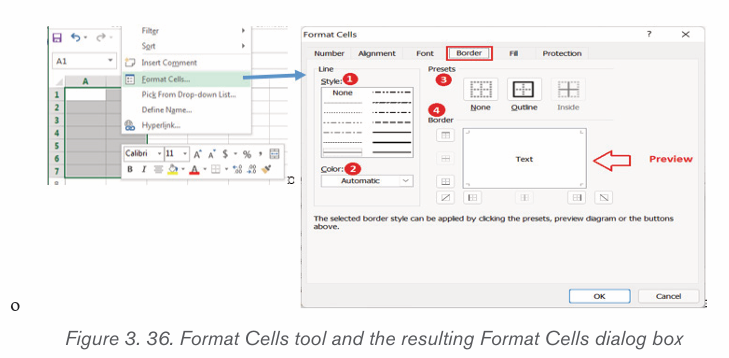
• Removing borders in Excel
To remove borders in the Excel worksheet, one of the following methods can
be used:
• Select the cells from which the borders are going to be . Click on Hometab then on Border then on No Border.
• To delete borders using the Erase border tool. For this, go to Home
then click on the Border tool then click on Erase Border. This
will convert the mouse cursor into an eraser icon, using it erase or
delete the desired border in the worksheet.
• Another method is: Select the cells and go to Home then Clear then
Clear All. Although this method helps remove borders, it also removesother formattings like font color, background color, etc.
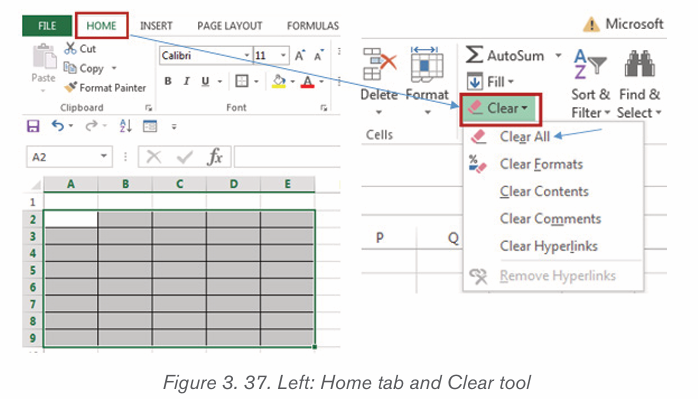
Application activity 3.5
1. Outline differents steps to delete borders
2. Create the following table and apply the different types borders asindicated below:
3.6. Creation of charts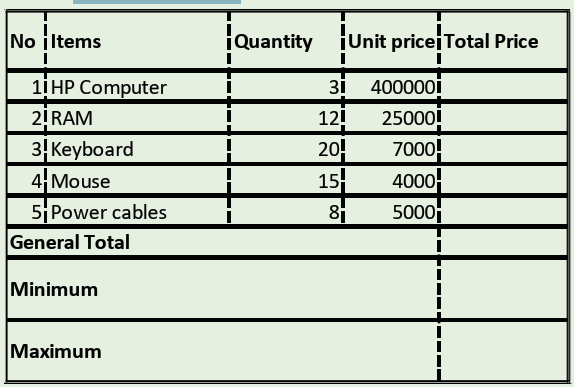
Activity 3.6
a. Identify different types of charts you know
b. Give the importance of using chart for data presentation
Charts allow you to illustrate workbook data graphically, which makes it
easy to visualize comparisons and trends. The data represented through
charts is more understandable than the data stored in an Excel table. This
makes the process of analyzing data fast.
A chart is often called a graph. It bring more understanding to the data
than just looking at the numbers. Excel offers many charts to represent the
data in different manners, such as Column Chart, Line Chart, Bar Chart, Area
chart, Pie Chart
To illustrate the different types of charts, the data used are those on a company
owning a small business of making different types of soap. The quantites ofsoaps in Tons made per year is shown in the table below:
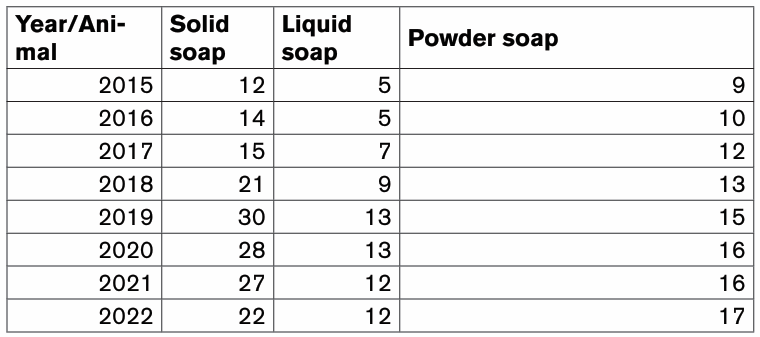
The different charts are inserted by following this procedure:
• Select the data then click on Insert
• In the Chart group choose one type of chart to be generated. If
among the visible templates the one needed is not available, click onthe See All Charts tool to view more chart types
A.Column Charts
A column chart is basically a vertical chart that is used to represent the data
in vertical bars. It works efficiently with different types of data, but it is usuallyused for comparing the information.
For example, the company wants to see whose data was shown above wants
to visualize its production progress from 2015 to 2022 using a column chart. To
make that column chart the following steps will be used:.
Step1: Select the data for which the chart is to be made
Step 2: On the Insert tab, in the Charts group, choose the type of chart
to use. In this case the type chosen is the Column chart. Click theColumn chart symbol
Step 4: Customize different settings of the created chart by changing the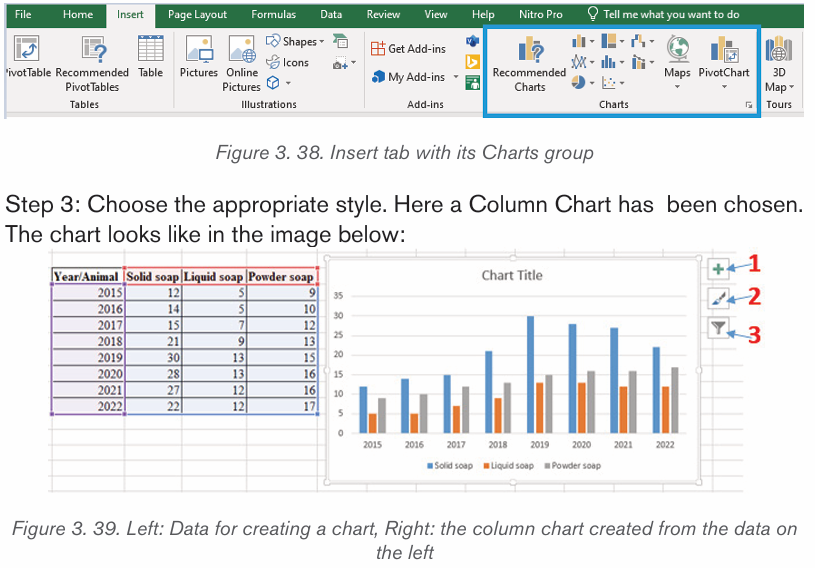
default chart title (Chart Title) and other settings which are done using the tools
labelled 1, 2 and 3. The tool 1 is used to add and edit charts elements, the tool
2 is used to choose any other variant of the chosen chart and the tool 3 is usedto remove the charts elements that are not needed.
• Adding chart elements
The chart for can be customized by adding new charts elements. Charts elements
can be added by clicking on the tool which is labelled as 1 in the above chart.
The chart below has been customized in order to add the Axis Titles, Data
labels. The different chart elements are added by ticking the correspondingcheckboxes.
• Changing the chart style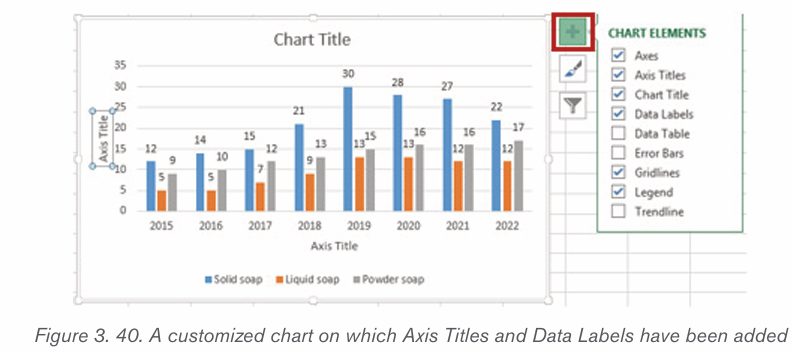
There are different types of chart which can be used depending on the
data to display. Switching from one chart type to another is done in this way:
Step 1: Select the chart for which the type is to be changed
Step 2: Click on the Chart Styles tool
Step 3: Click on the new chart type. In this case the chart labelled with an arrowwas selected.
Apart from these operations, one can add new elements or remove them using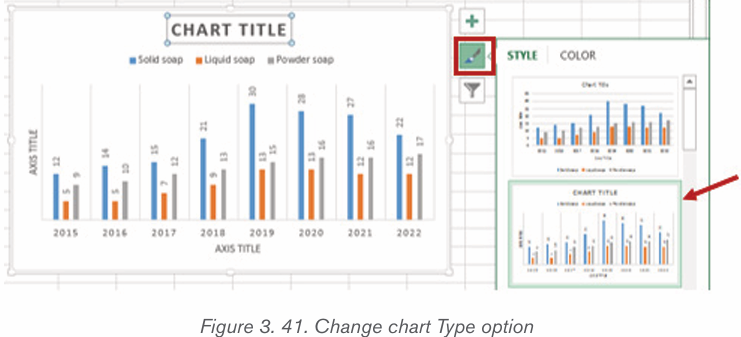
the Chart Filters option allow to add or remove chart elements like Chart series.
A. Line Chart
Line charts are most useful for showing trends. Using this chart, you can easily
analyze the ups and downs in data over time. In this chart, data points areconnected with lines.
With the company’s data, a line chart showing the status of the quantities of
soap produced can be created like by following this procedure:
• Select the data for which the chart is to be created
• Click on the Insert tab
• In the Charts group click on one type of chart here click on the Line Chart
Next to the line chart above there are three tools which are used to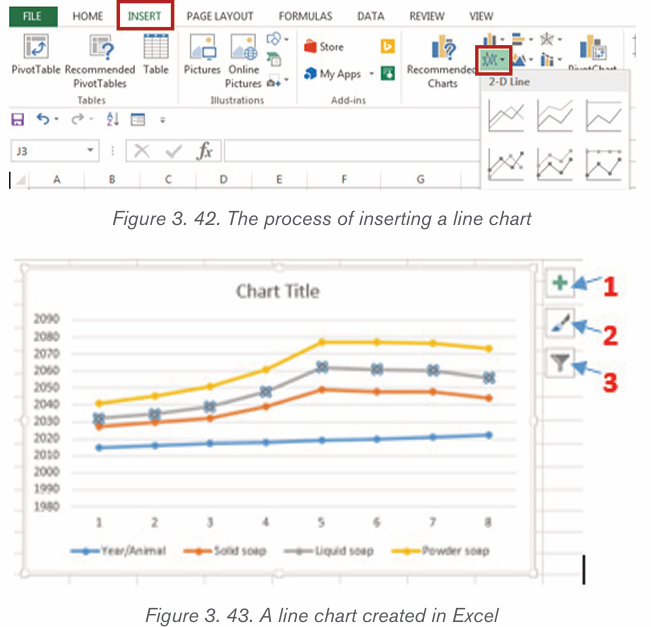
edit it namely has s tools next to it which are used the Chart Element
tool (1), the Chart Styles tool and the Chart filters tool.
A.Bar chart
Bar charts are horizontal bars that work like column charts. Unlike column charts,
Bar charts are horizontally plotted. Or you can say that bar charts and column
charts are just opposite to each other.
The data used in creating line chart and column chard can generate the barchart below:
The chart above was obtained by using the same procedure as for other charts.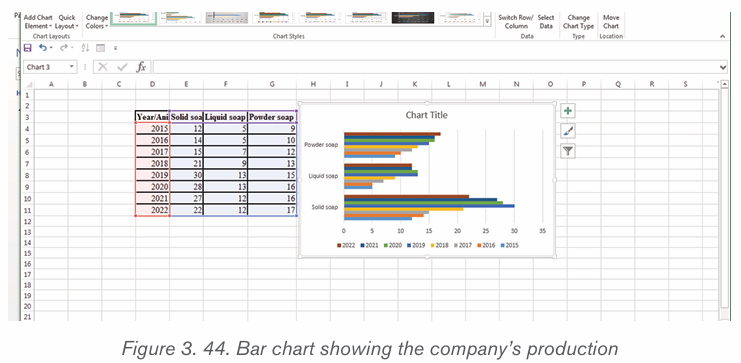
This procedure involves clicking the INSERT tab then click on the type of chart
which is now the bar chart and finally selecting the variant of the chart to be
applied. This chart can be edited using the tools on its left which are ChartsElements, Chart Styles, Chart Filters.
A. Area chart
Area charts are just like line charts. Unlike the line charts, gaps are filled with
color in area charts. They are easy to analyze the growth in business as its
shows ups and downs through line. Information in an area chart is plotted on
the x and y axis; data values are plotted using data points that are connectedusing line segments.
The data that was used to create the different charts generate the chart below:
The chart above was created by first selecting the data then clicking on the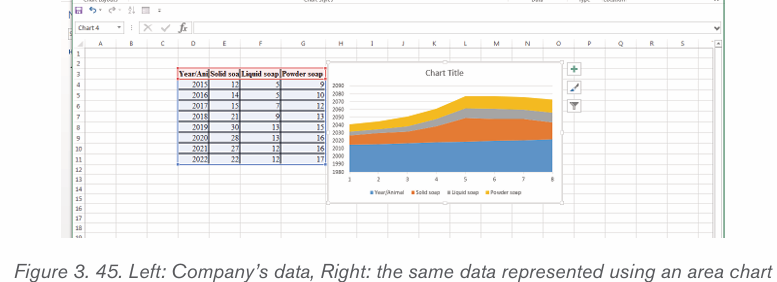
Insert tab then click on on the Area Chart and then choosing one type of chartto use. In the screenshot below, the area chart use is in a red rectangle.
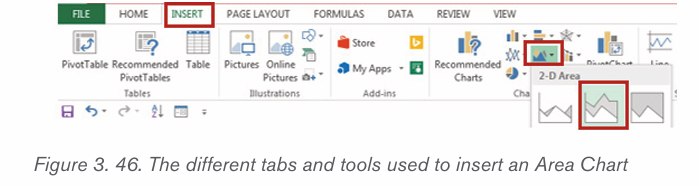
A. Pie chart
A pie chart is a rounded shape graph that is divided into slices of pie. Using this
chart, you can easily analyze data that is divided into slices. It makes the dataeasy to compare the proportion.
Like other charts, a pie chart is inserted by selecting the data then clicking on
the Insert tab and choosing the type of chart which is the Pie chart. This processis shown below:
The generated chart lacks some details to be easily understood. That is why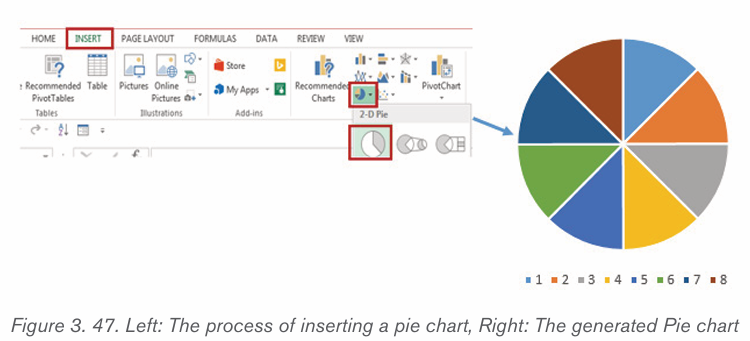
details can be used by using the Charts Elements, Chart Styles and Chart
Filters tools. To add those details just click on the tool and check the detail toappear on the chart.
The different chart tools shown above can be used to change other charts of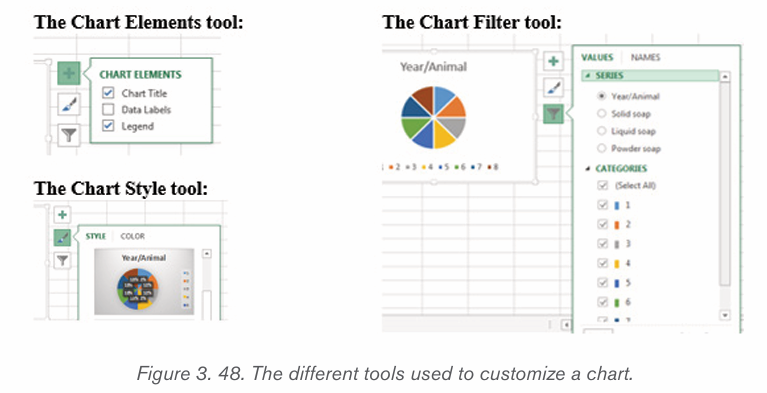
the same category like the ones shown below:
Application activity 3.6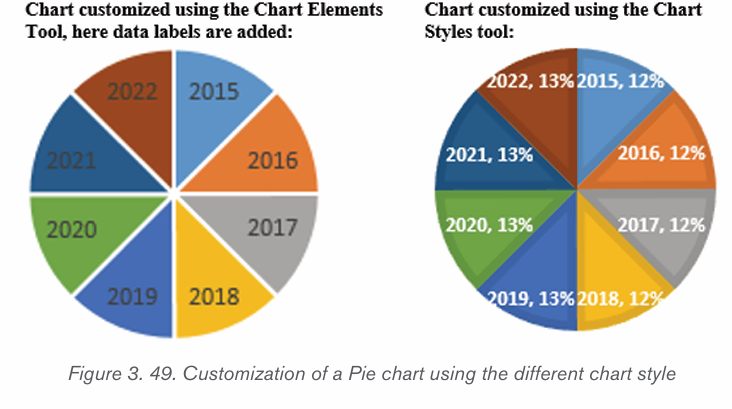
1. Use the following table to create :
• Line chart
• Column chart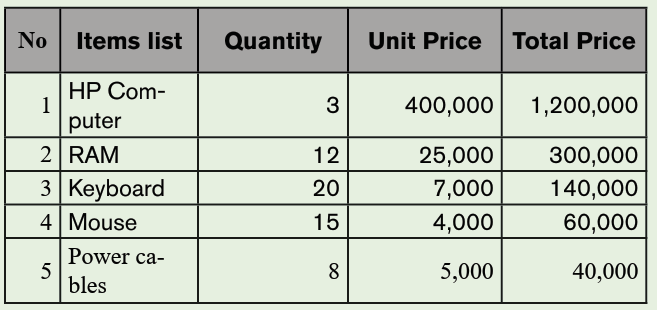
3.7. Data organization
Activity 3.7
By doing a research using the internet or any other resource
a. Discuss the types of sorting.
b. Outline different steps of sorting list in ascending order
c. What do you understand by filtering data?
After data has been entered into an Excel worksheet and even after it has been
organized into a table, it can still be manipulated and reorganized. One of the
easiest options is to sort data in a particular order for example, sorting data
in alphabetical order. On the other hand, Filtering data allows to analyze data
easily. When data is filtered, only rows that meet the filter criteria is going to
be displayed and other rows will be hidden. Filters narrow down the data in a
worksheet, allowing to view only needed information.
3.7.1. Filtering data
After entering data in Excel, it is also possible to filter, or hide some parts of the
data, based on user-indicated criteria. When using the Filter option, no data is
lost; it is just hidden from view.
In order for filtering to work correctly, the worksheet should include a header
row which is used to identify the name of each column and is used for filtering.
Follow these steps for filtering data in an excel table:
Step 1: Select the Data tab, and then click the Filter command. Immediately
a drop-down arrow will appear in the header cell for each column. The filter
command can also be accessed by clicking the Home tab and finding it at the far
right side of the menu in the Editing Group.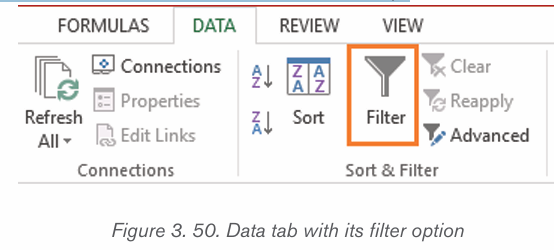
Step 2: Click the drop-down arrow for the column you want to filter. In this
activity, filter column B (Region) is filtered to view only certain region.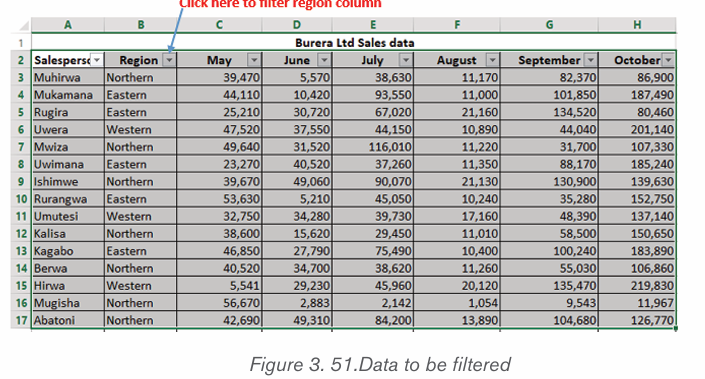
Step 3: In the Filter menu that will appear uncheck the box next to Select All to
quickly deselect all data. When the Select All checkbox is unchecked, all the
other checkboxes will also be unchecked.
Step 4: Check the boxes next to the data you want to filter, and then click OK.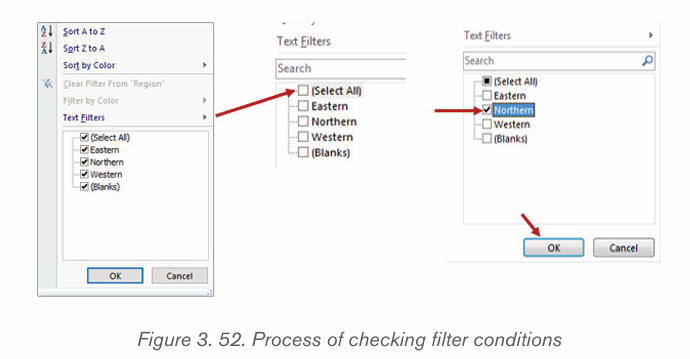
In this example, Northern is checked to view only those types of equipment
matching the criteris. The data will be filtered, temporarily hiding any content
that doesn’t match the criteria.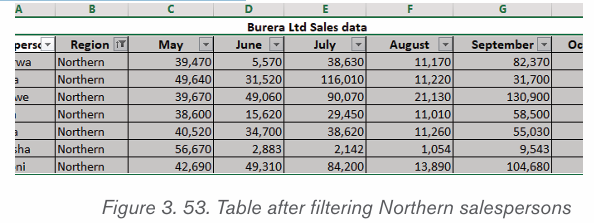
3.7.2. Clear a filter
After applying a filter, you may want to remove or clear it from your worksheet so
you’ll be able to filter content in different ways.
Step 1: Click the drop-down arrow for the filter you want to clear the Filter
menu will appear.
Step 2: Choose Clear Filter from [COLUMN NAME] from the Filter menu. In
this case the option Clear Filter from «Region» is selected
Step 3: The filter will be cleared from the column. The previously hidden data
will be displayed like the data was before applying the filter.
3.7.3. Sorting
Sorting refers to ordering data in an increasing or decreasing fashion according
to some linear relationship among the data items. Sorting can be done onnames, numbers and records.
Below are steps to sort data:
Step 1: Select the entire table you want to sort
Note: In most cases, you can select just one cell and Excel will pick the rest
of the data automatically, but this is an error-prone approach, especially whenthere are some gaps (blank cells) within the data.
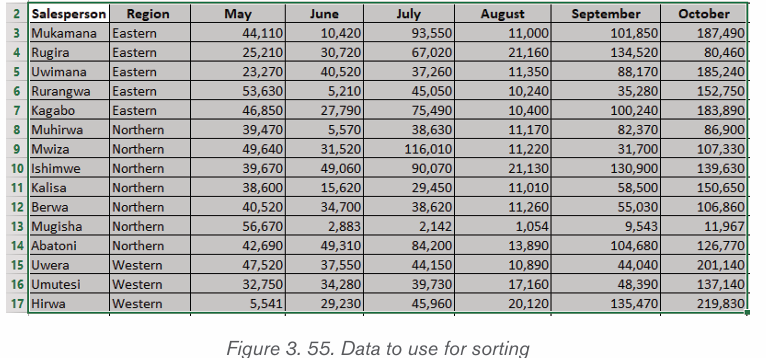
Note: If the first dropdown is showing column letters instead of headings, tick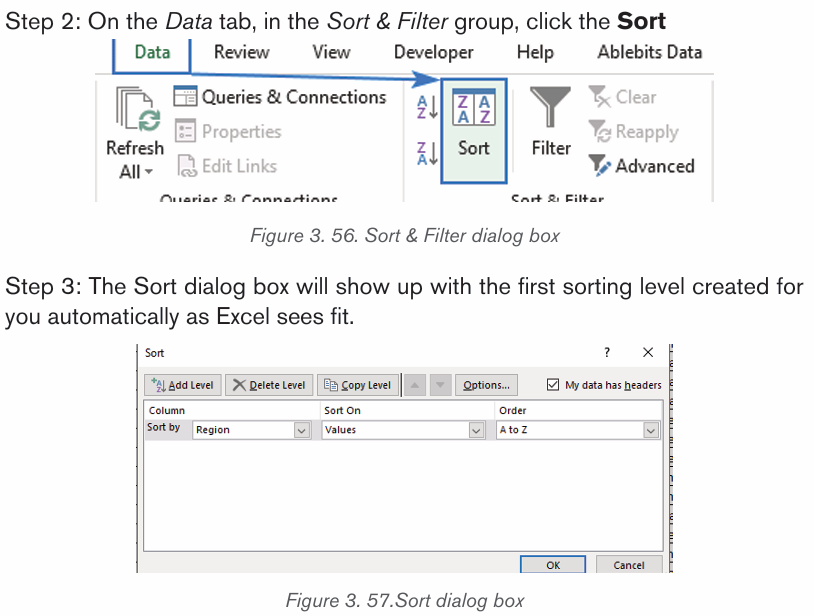
off the “My data has headers” box.
Step 4: Click the Add Level button to add the next level and select the optionsfor another column.
Note: If you are sorting by multiple columns with the same criteria, click Copy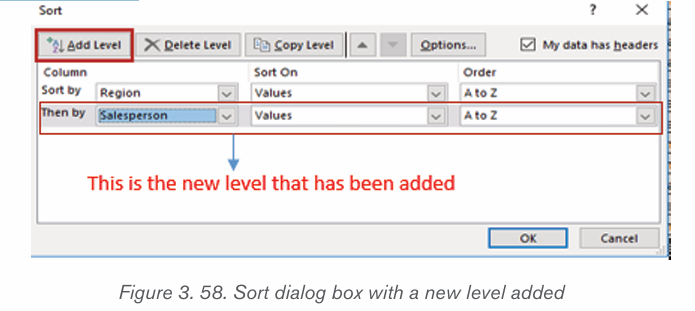
Level instead of Add Level. In this case, you will only have to choose a different
column in the first box.Step 5: Add more sort levels if needed, and click OK.
By sorting data by Region and then by Salesperson the data will be sorted firstby the Region column then the second condition will be by Salesperson.
Excel sort data in the specified order. As shown in the screenshot above,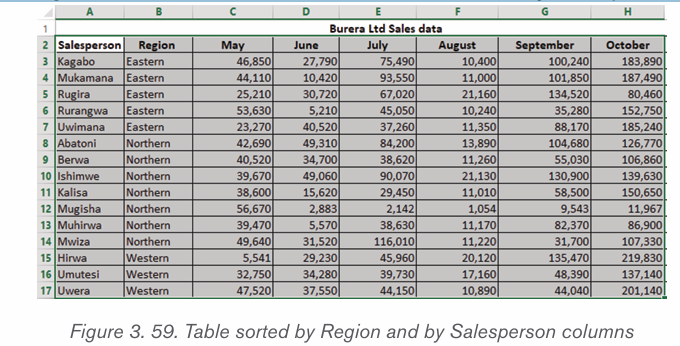
data is arranged alphabetically exactly as it should: first by Region, and thenby Salesperson
3.8. Financial functions
Application activity 3.8
1.Study the following table and answer the related questions:
ii) Display the list of Items by ascending order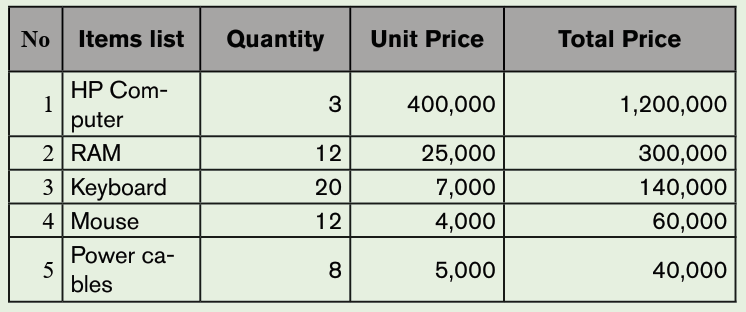
iii) Print the Total price by descending orderiv) Filter the items whose quantity is 12
Financial functions refer to the functions used to calculate financial information,
such as net present value, future value and payments. For example, you cancalculate the monthly payments required to buy a car at a certain loan rate.
3.8.1 The Net Present Value (NPV) Function
Net present value (NPV) is the difference between the present value of cash
inflows and the present value of cash outflows over a period of time. NPV is
used in capital budgeting and investment planning to analyze the profitability ofa projected investment or project.
The NPV Function as an Excel Financial function will calculate the Net Present
Value (NPV) for a series of cash flows and a given discount rate. It is important
to understand the Time Value of Money, which is a foundational building blockof various Financial Valuation methods.
The calculation of the NPV requires the identification of the number of periods.
For example if there is a monthly cash flow for 5 years, there are 60 cash flowsand 60 periods. It also requires to identify the discount rate .
The syntax of NPV Function is:
=NPV(rate,value,[value2],…)
The NPV function uses the following arguments:
1. Rate (required argument) : This is the rate of discount over the length of
the period.
2. Value1, Value2 : Value1 is a required option. They are numeric values
that represent a series of payments and income where:
• Negative payments represent outgoing payments.
• Positive payments represent incoming payments.
For the example below the required rate of return is 10%. To calculate the NPV,use the formula and press enter key to get a result
The NPV formula is based on future cash flows. If the first cash flow occurs at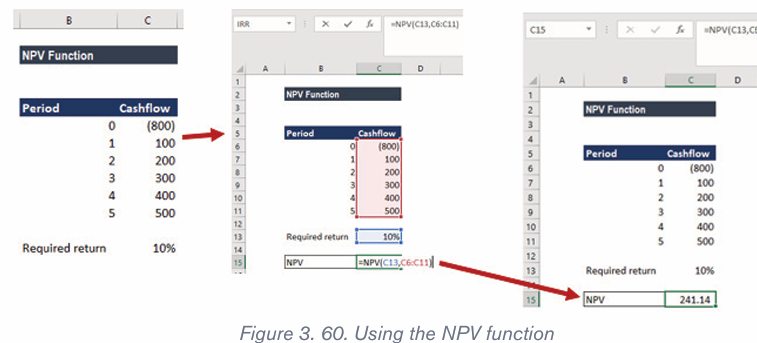
the start of the first period, the first value must be added to the NPV result, notincluded in the values arguments.
3.8.2 The Future Value (FV) Function
Value of the money doesn’t remain the same; it decreases or increases because
of the interest rates and the state of inflation, deflation which makes the value of
the money less valuable or more valuable in future. But for financial planning of
what we expect the money for our future goals, we calculate the future value ofthe money by using an appropriate rate in a future formula.
The Future Value formula gives the future value of money for the principle orcash flow at given period.
FV is the Future Value of the sum, PV is the Present Value of the sum, r is the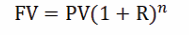
rate taken for calculation by factoring everything in it, n is the number of years
Example of Future Value Formula
In order to have a better understanding of the concept, calculate the future
value by using the above-mentioned formula.
Calculate the future value of 15,000,000 Rwf loaned at the rate of 12
percent per annum for 10 years.To calculate the future value,
PV =15,000,000, R = 12 %, N= 10FV = PV (1+R)n, FV = 15000000 (1 + 0.12)10, FV = 46587720
Here the Present Value used is 15000,000, a rate of the period which is in yearsas 0.12, the number of periods which is year 10 years.
Here 1.12 rate is raised to power 10, which is in years multiplied by the principle15000,000.
It is very much used in each and every aspect of finance, whether it’s investments,
corporate finance, personal finance, accounting etc.
The future Value of an investment depends on purchasing power it will be having
and the return of investments on the capital.
Now, this cumulative of inflation and investment return is factorized in one termas the rate of return for the period.
Therefore,
FUTURE VALUE = PRESENT VALUE + INCURRED RETURN ONINVESTMENT
Now to calculate this future value, we need to understand the value calculated
will be used with a compounded rate of return over the years on the presentvalue of the capital.
This can be explained by the example below:
10 percent interest and capital is 1000, so the Future Value will be 1100
equivalent to 1000+ 100. To calculate for 2 years, we can calculate by using
1100 + 110 = 1210 which can also be written as 1000 (1.1) ^2 which will
make the calculation to 1.21 * 1000 = 1210
This way, calculate the future values of any amount when an interest rate is
given by the formula PV x (1 + r)n
The calculation of Future Value in Excel is very easy and can take many variables,which can be very difficult to calculate otherwise without a spreadsheet.
The syntax of FV function:=FV(rate, nper, pmt,[ PV])
Example: What will the amount after the principle of 10000 is invested
for 10 years and 1000 is invested every year at the rate of 17 percentper annum.
Now, as soon as you put in the FV function and start a bracket, the excel asks you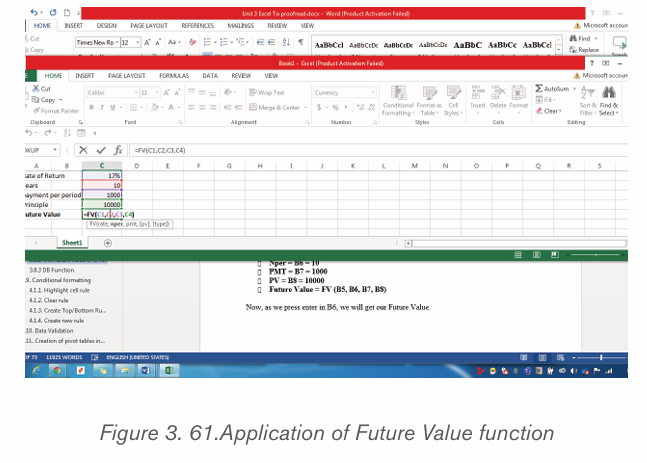
to open the bracket and give rate (rate), a number of periods (nper), payment
per term (pmt), Present Value (PV) close brackets.
Now following the problem above: Rate = B5 = 17%, Nper = B6 = 10, PMT
= B7 = 1000, PV = B8 = 10000Future Value = FV (B5, B6, B7, B8)
3.8.3. DB Function
The DB function is an Excel Financial function which helps in calculating the
depreciation of an asset. The method used for calculating depreciation isthe Fixed Declining Balance Method for each period of the asset’s lifetime.
The syntax of DB Function:
=DB(cost, salvage, life, period, [month])
• Cost (required argument): This is the initial cost of the asset.
• Salvage (required argument): The value of the asset at the end of the
depreciation.
• Life (required argument): This is the useful life of the asset or the
number of periods for which we will be depreciating the asset.
• Period (required argument): The period for which we wish to calculate
the depreciation for.
• Month (optional argument): Specifies how many months
of the year are used in the calculation of the first period ofdepreciation. If omitted, the function will take the default value of
Activity 3.9
Open Excel and enter data in the table below. Save the File as “Burera Ltd Sales data”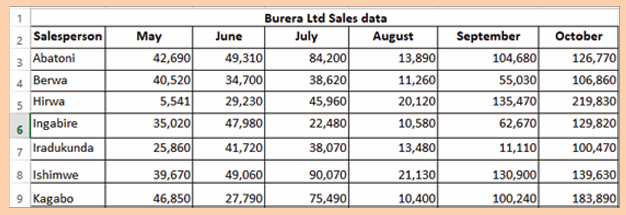
Do the followings:
3. Using Burera Ltd Sales data, show salespersons who
are meeting their monthly sales goals. The sales goal is50,000 items per month
4.Highlight all salesperson whose sales are below the average.
5.Highlight with blue color all salesperson whose sales are above6.80,000
DB Function in Excel
Example 1:
Assume we wish to calculate the depreciation for an asset with an initial cost
of 100,000 Rwf. The asset’s salvage value after 5 years is 10,000 Rwf. The
screedshot below shows how to calculate it. The results are got after hitting theEnter key:
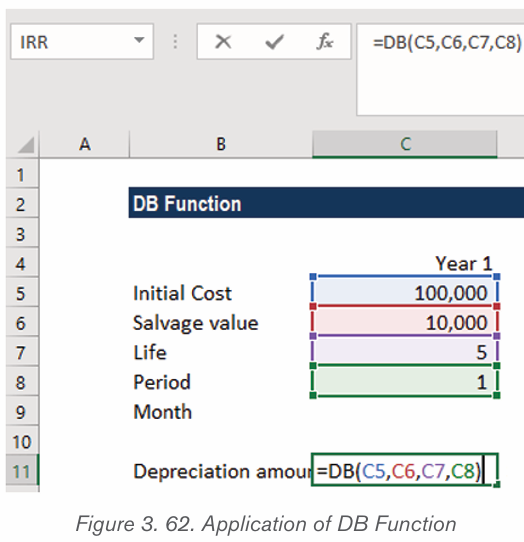
Application activity 3.8
1.Explain all necessary arguments used by DB function
2. What will the amount be (Future Value) after the principle of
2500000 Rwf is invested for 8 years and 15000 is invested everyyear thereafter at the rate of 14 percent?
3.9. Conditional formatting
Conditional formatting is an especial feature (formatting feature) of Excel used to
find unique and duplicates values by formatting the cells. Conditional formatting
allows the users to format the cells and their data based on some conditions
specified by the user. Using conditional formatting, you can highlight a cell witha certain color and its content with different font.
Conditional formatting enables spreadsheet users to do a number of things.
First and foremost, it calls attention to important data points such as deadlines,
at-risk tasks. It can also make large data sets more digestible by breaking up
the wall of numbers with a visual organizational component. Among the options
provided by conditional formatting are: highlight cell rules, top bottomrules, customized rules, etc
3.9.1. Highlight cell rule
Conditional formatting can be used to enhance the reports and dashboards
in Excel. The conditional formatting statement under the Highlight Cells Rules
category allow to highlight the cells whose values meet a specific condition.
The benefit of a conditional formatting rule is that Excel automatically reevaluates
the rule each time a cell is changed provided that cell has a conditional formatting
rule applied to it. Those rules include: greater than, less than, equal to, between,
text that contain, A Date occurring, duplicate values, …
Here are the steps to apply the highlight cell rule:
Step 1: Select the desired cells on which to apply the conditional formatting rule
Step 2: From the Home tab, click the Conditional Formatting command.A drop-down menu will appear.
Step 3: Hover the mouse over the desired conditional formatting type, and then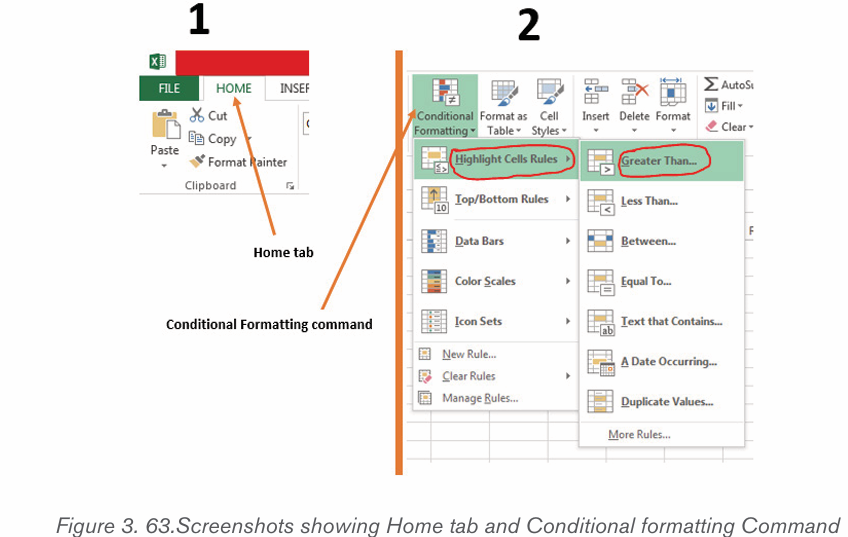
select the desired rule from the menu that appears. In the Activity 4.1, we wantto highlight cells that are greater than 50, 000.
Step 4: A dialog box will appear. Enter the desired value(s) into the blank field.In the case of the activity 4.1.the taken value is 50, 000.
Step 5: Select a formatting style from the drop-down menu. In the Activity 4.1,
the color to choose is Green Fill with Dark Green Text, then click OK.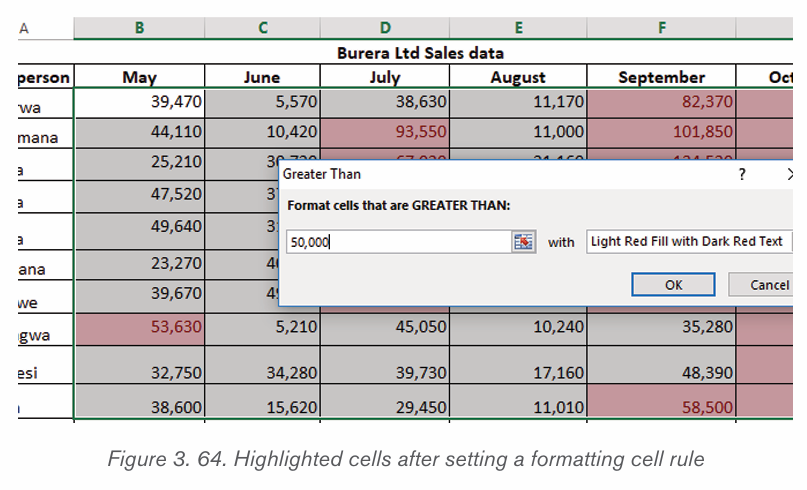
Step 6: The conditional formatting will be applied to the selected cells. In our
case, it’s easy to see which salesperson reached the 50, 000 sales goals foreach month.
Note: You can apply multiple conditional formatting rules to a cell range or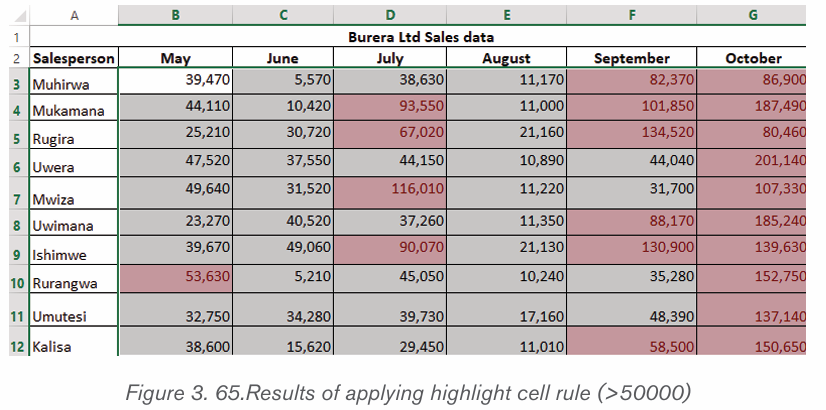
worksheet, allowing you to visualize different trends and patterns in your data.
3.9.2. Clear rule
Rules that have been used to highlight cells that meet certain conditions can be
removed and have text with no highlight when the rules are no longer needed orwhen there is a need to set new rules. To clear rules do the following:
Step 1: Select the desired cells for clearing the conditional formatting rule
Step 2: On the Home tab, in the Styles group, click Conditional Formatting
(refer to Figure 4.1.)
Step 3: Click Clear Rules then click Clear Rules from Selected Cells
After clearing rules for selected cells, cells are no longer colored, there is no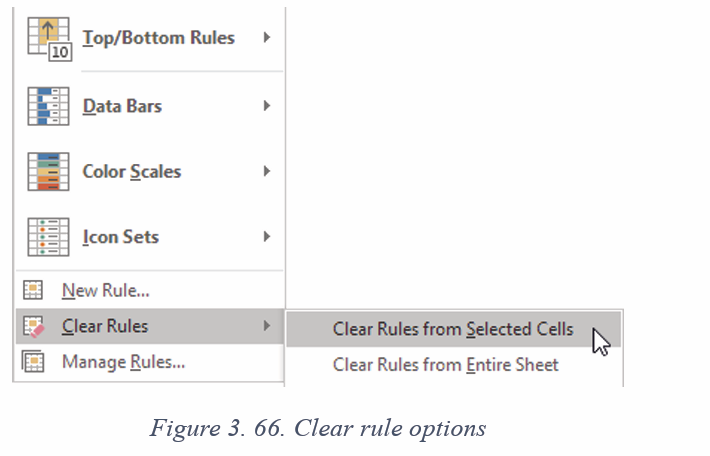
more formatting in cells.
3.9.3. Create Top/Bottom Rules
Top/Bottom rules are another useful Conditional Formatting in Excel. These
rules allow users to call attention to the top or bottom range of cells, which can
be specified by number, percentage, or average.
Step 1: Select the desired cells for the conditional formatting rule
Step 2: From the Home tab, Select Conditional Formatting then Top/Bottom Rules then click Above Average…
Step 3: A dialog box will appear. Choose color format to use like “Light Red Fill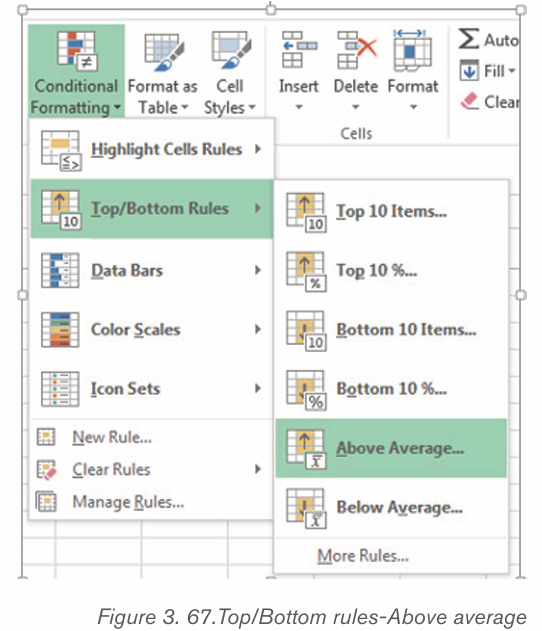
with Dark Red text”. After choosing cells format, Press “OK”
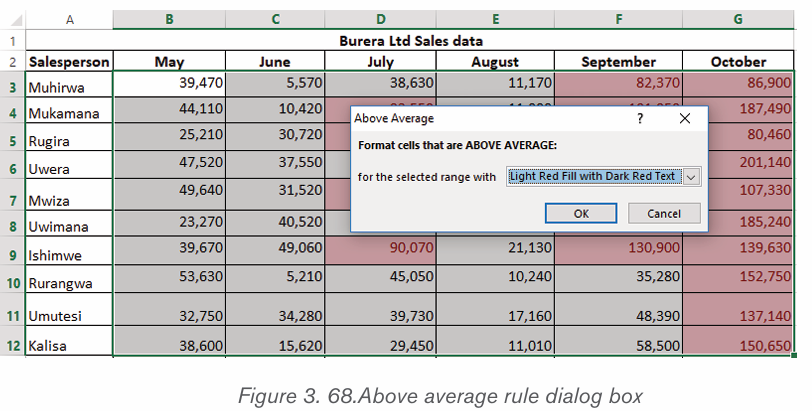
Step 4: Your sheet will now highlight the values above the average
3.9.4. Create new rule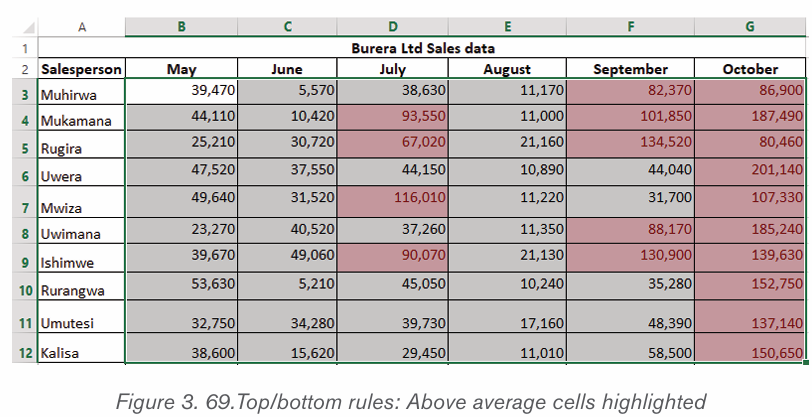
Excel allows to create a formula-based conditional formatting rule. The available
options are:
• Formatting cells based on their values,
• Formatting cells that contain certain values,
• Formatting only top or bottom ranked values,
• Formatting only values that are below or above average,
• Formatting only unique or duplicate values and using a formula to
determine which values to format.All those options are presented in the window below:
Step 1: Select the cells you want to format. In the Home tab click on Conditional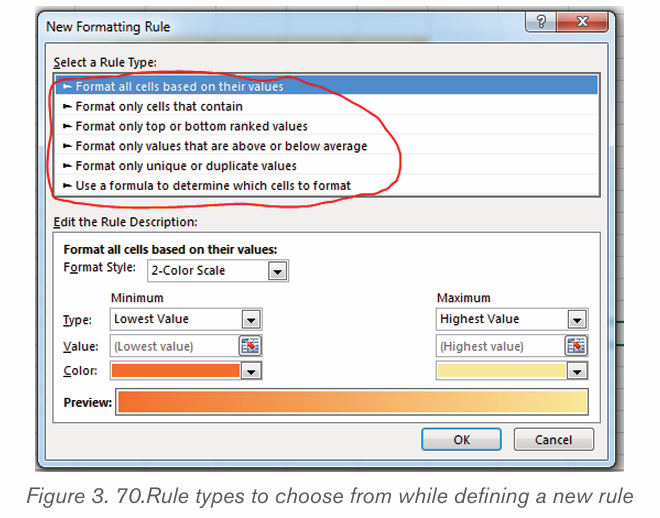
Formatting command and click New rule
Step 2: Create a conditional formatting rule, and select the Formula option then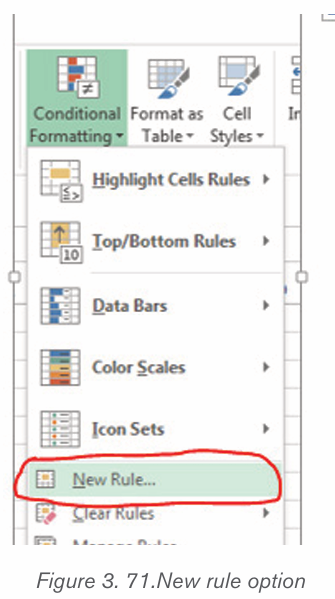
click OK. In the window below the option “Use a formula to determine which
cells to format” has been chosen
g) Format all cells based on their values
Step 1: New formatting rule window will be opened.
Step 2: Select Format all cells based on their values option, however this is bydefault selected.
In this case only 2 options are going to be used: 2-color scale and 3-color scale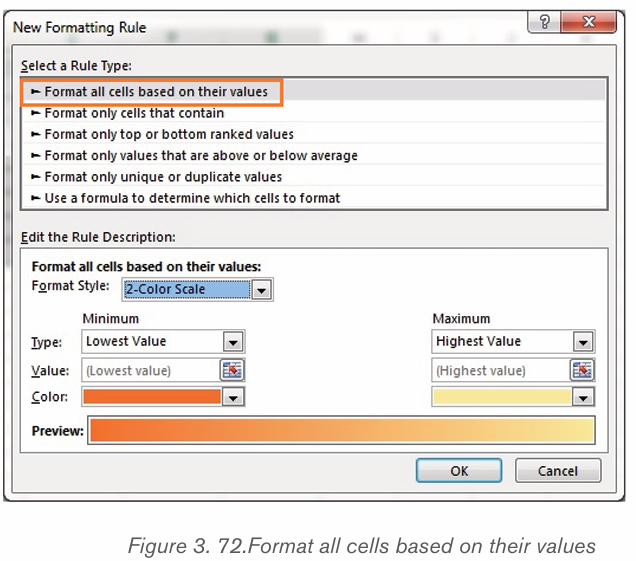
h) 2-color scale
Step 1: Choose minimum and maximum valuesStep 2: Click Ok button to apply this conditional formatting
Step 3: Data set with this condition formatting will look like below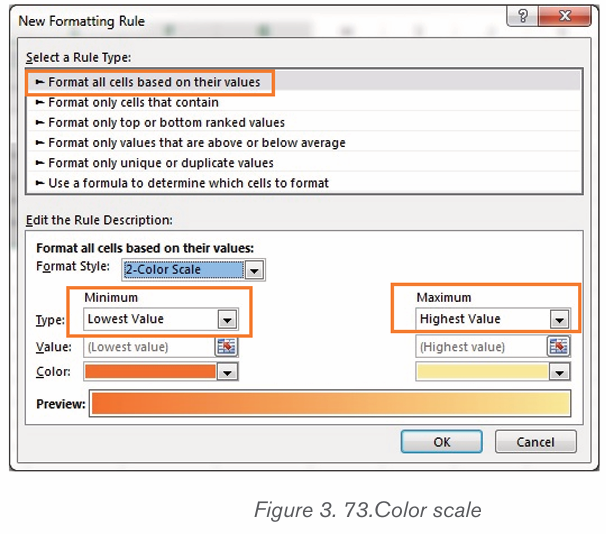
Note: we have chosen minimum number to 50,000 and the maximum to 80,000,then selected a colors to separate both values.
i) 3-color scale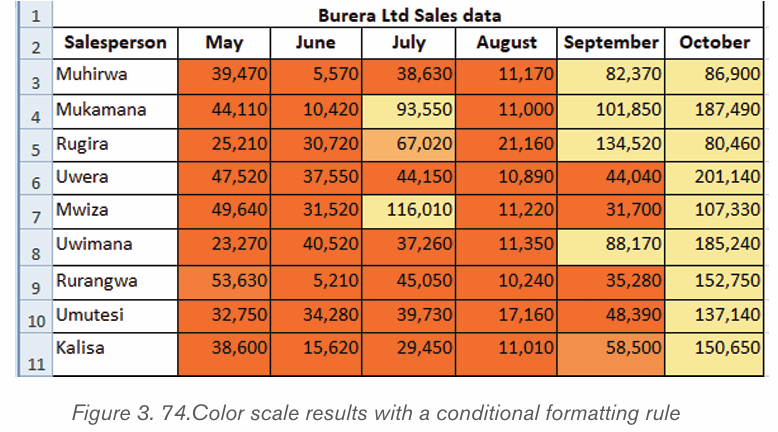
Step 1: New formatting rule window will be opened.
Step 2: Select Format all cells based on their values option, however this is by default selected.
Below are steps to apply 3 -color formatting style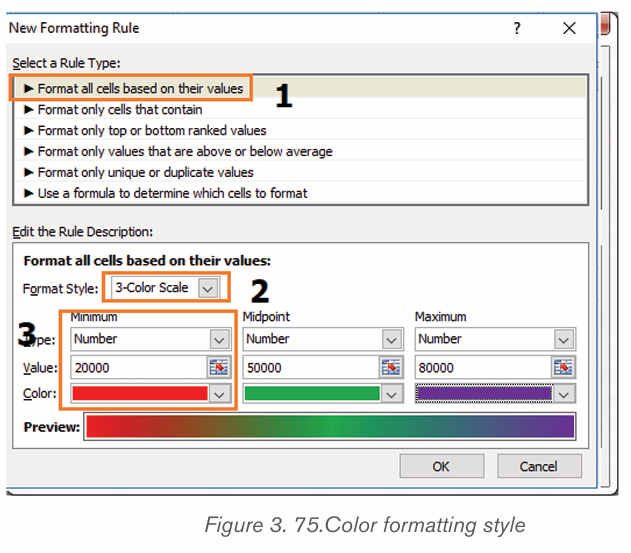
Step 3: select 3 color scale option in format style
Step 4: choose the type; here we are taking as Minimum, Midpoint and Maximum
Step 5: Put values for number for Minimum, Midpoint and MaximumThen, results are displayed as follow:
2. Use a formula to determine which cells to format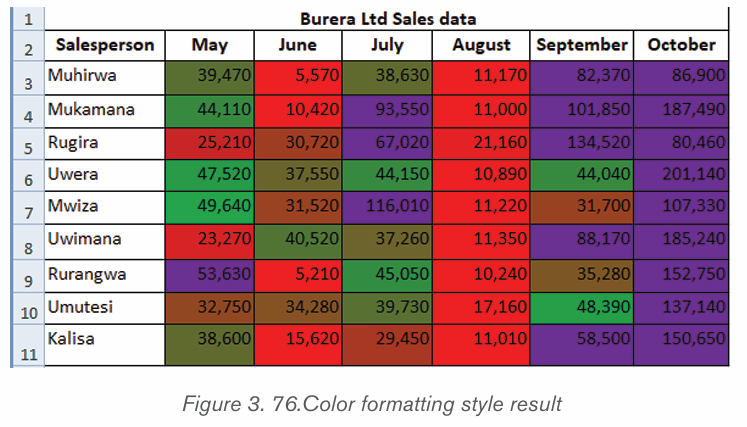
New rules can be created by customizing own formulas. By using custom made
formula, a custom condition that triggers a rule is created and can be applied as
the user needs it to be applied. In the data that is going to be used the formula
=B3>80000 has been applied for formatting.
To specify the formatting formula click on Conditional Formatting tab then New
Rule and choose Use Formula to determine which cells to format as in thewindow below:
Step 3: Enter a formula that returns TRUE or FALSE then set formatting options,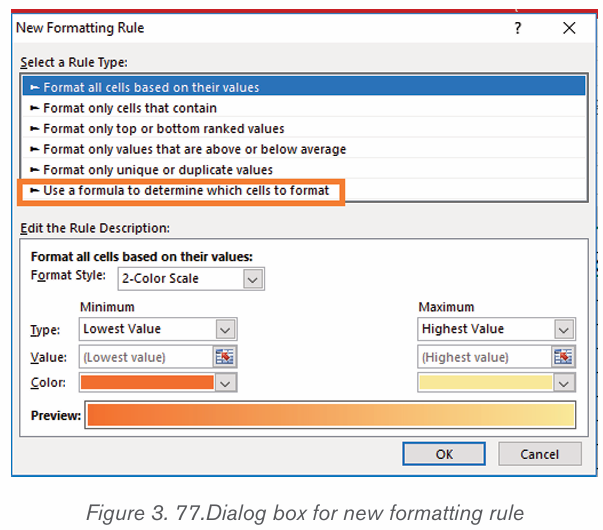
save the rule and press OK
After clicking OK cells that meet the formatting rule are highlighted as specified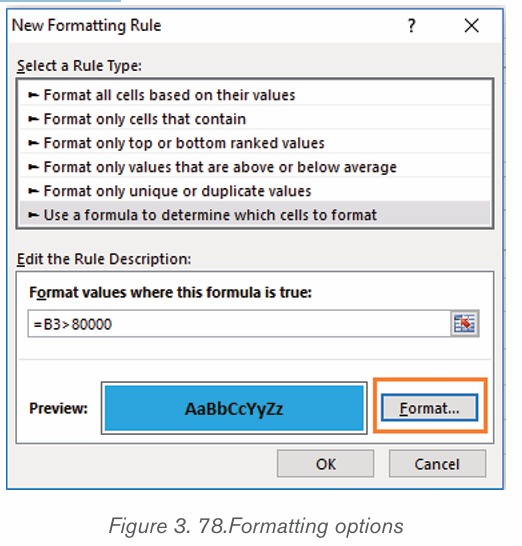
in the new rule. In the window below cells meeting the criteria are blue coloredas it has been specified.
Note: Always write the formula for the upper-left cell in the selected range.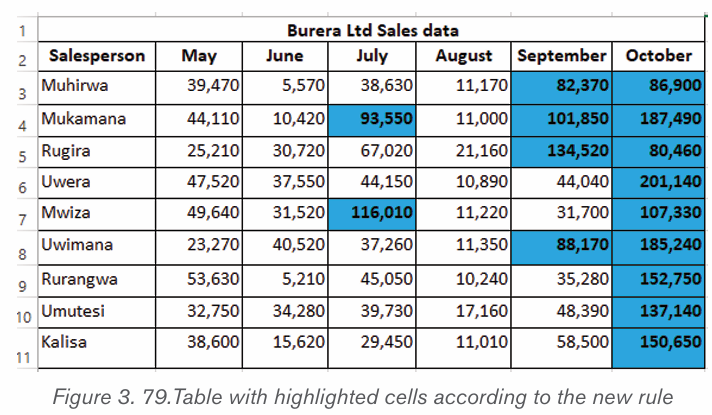
Excel automatically copies the formula to the other cells. Thus, cell B3 contains
the formula =B3>80,000, cell C3 contains the formula = B3>80,000 and etc.
Below are some formulas that apply conditional formatting and return TRUE or
FALSE, or numeric equivalents.
=ISODD (A1): The ISODD function is used to check if a numeric value is an
odd number. ISODD returns TRUE when a numeric value is odd and FALSE
when a numeric value is even. If value is not numeric, ISODD will return the
#VALUE error.
SODD (A1) returns TRUE if A1 contains the number 3 and FALSE if A1 contains
the number 4.Usually, value is supplied as a cell address.
ISODD is part of a group of functions called the IS functions that all return thelogical values TRUE or FALSE.
1) =ISNUMBER (A1): The ISNUMBER function is used to check if a value
is a number. ISNUMBER will return TRUE when value is numeric and
FALSE when not.
2) ISNUMBER (A1) returns TRUE if A1 contains a number or a formula
that returns a numeric value. If A1 contains text, ISNUMBER will return
FALSE.
3) AND (A1>100, B1<500): The AND function is used to apply more
than one condition at the same time, up to 255 conditions. Each logical
condition (logical1, logical2, etc.) must return TRUE Examples
4) AND (A1>100, B1<500) test if the value in A1 is greater than100 andB1 less than 500
Application activity 3.9
• Given the following data tables :
1. Using conditional formatting highlight with red color the total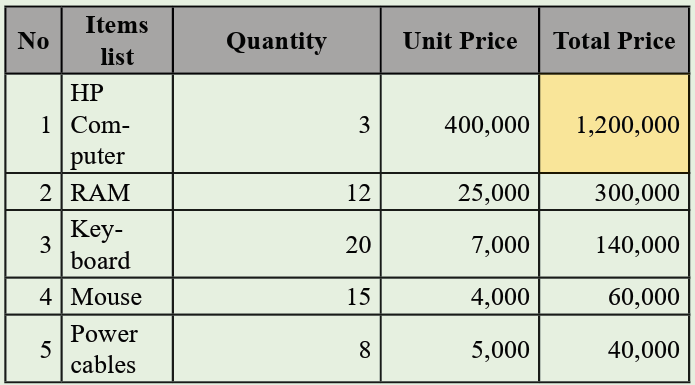
prices which costed between 150,000 and 500,000
2. Apply conditional formatting on Total price using data bars
3. Apply conditional formatting on Unit price using Color scales4. Apply conditional formatting on Quantity using Icon sets
3.10. Data Validation
Activity 3.10
1.What do you understand by data validation ?
2. What is the importance of applying data validation
Data Validation is one of the essential features in MS Excel. When creating an
Excel sheet for users or customers, you may often need to restrict the inputs
based on different criteria to ensure that all the entries or inputs are correct and
consistent. Data Validation is the solution that helps to control user inputs intospecific cells or a range according to the specified rules.
Some of the essential tasks (restrictions/ validations) that can be set using the
Data Validation are as follows:
• Allow users to put numeric or text entries only
• Allow entering numbers less than, more than and between a
specified range
• Allow data inputs of a specific length
• Restrict entries to predefined values in a drop-down list
• Restrict date and time entries outside or within a specific range
• Validate a specific entry based on another cell
• Display an input message informing users what the corresponding
cell accepts when the user selects a cell
• Display a warning or error message when the user enters wrong data
• Locate incorrect or wrong entries in the validated cells
Applying Data Validation on any cell or range of cells in an Excel sheet restricts
the users from entering any undesired entries in corresponding cells based on
the validation rules. For instance, if we set validation to accept only numbers
or numeric values, other users will not be able to enter any values other than
numbers. The Excel data validation window is displayed after clicking on the
Data tab then click on Data Validation. After the Data Validation window is
available, choose among the different optins which are available by clicking onthe Setting tab, Input Message tab, Error Alert tab.
Data Validation can be configured to show an input message to users when the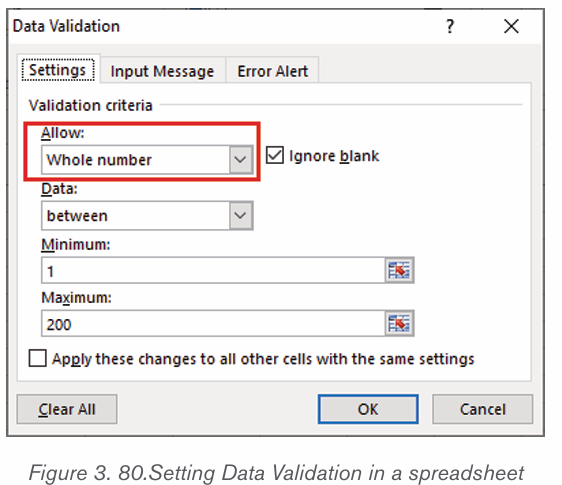
respective cell is selected, informing them what is allowed in it, as shown below:
As soon as we try to enter any other type of data in restricted cells, Excel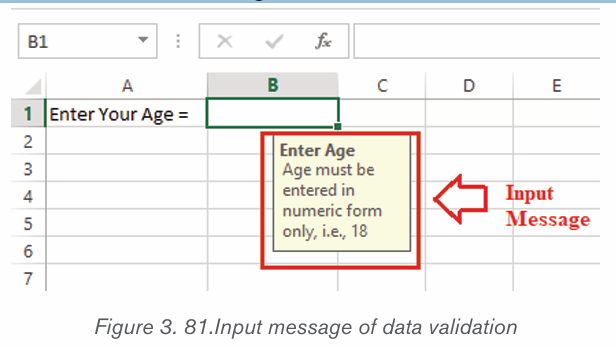
instantly displays an error message and even can display which type of data
the respective cells can accept. The error message can be of different styles
and customized or created manually while setting up the validation rules on theExcel sheet.
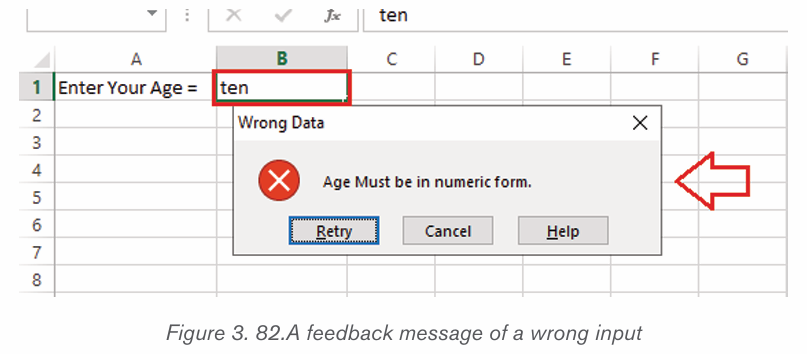
• Data Validation Controls
The Data Validation feature or its controls can be found on the ribbon under the
Data tab. By default, it is placed under the category ‘Data Tools’.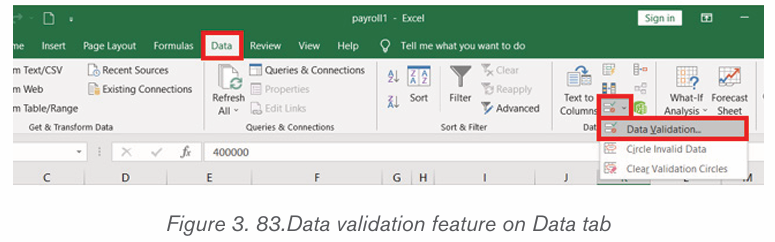
As soon as Data Validation icon is clicked from the ribbon, it immediately
launched a Data Validation dialog box. In addition to the Data Validation
shortcut on the ribbon, the keyboard shortcut ‘Alt + D + L’ can be used without
quotes. It will launch the Data Validation dialog box instantly.
Using Data Validation Dialog Box to Define Validation Rules
The Data Validation dialogue box contains three essential options/ tabs: Settings,
Input Message, and Error Alert.
• Settings Tab
The settings tab provides us options to set validation criteria. The tab helps us
choose the desired validation rules from the built-in options we want to allow
in selected cells. Moreover, we can also set custom rules with the customized
formula to validate user inputs. The settings tab contains all the data validationoptions present in Excel.
• Input Message Tab
The input message tab has a text box to enter a message displayed as soon
as the respective cell is selected. The input message is an optional feature of
Data Validation. If we do not define any message as an input message, excel
does not show any message when the user selects the respective cell with data
validation. It does not affect the working of the data validation and has no effect
or control over what the user enters into a cell. However, it can be helpful toinform users about the allowed or expected data values.
• Error Alert Tab
The error alert tab provides options to control the way how the validation is
enforced. We can set criteria and then use any desired error style to accept or
reject the user inputs accordingly. Additionally, we can also display a message
to the user informing what the error is or what values must be entered incorresponding cells.
• Adding Data Validation in Excel
Step 1: Launch the Data Validation dialogue Box
To add a data validation in an Excel sheet, we must perform the following steps:
First, select all the cells or a range to which to apply the validation. Next, ckick
the Data tab. In the Data Tools group and select Data Validation tool tolaunch the data validation dialogue box.
Step 2: Set the Data Validation Rule
After the data validation dialogue box is displayed, go to the Settings tab to
define validation criteria. Provide the desired values, cell references, or formulasin the validation criteria.
After all the validation settings have been set, click the OK button to close the
validation dialog box or move to the next tab to insert an input message and/orerror alerts.
Step 3: Create an Input Message to Display (Optional)
To display a message to the user saying which type of data is supported
or allowed in the selected cell, use the input message tab. Using the input
message, the useris informed about the allowed data type format when the user
selects corresponding cells.
Once the input message is entered, click the OK button or move to the Error
Alert tab further.
Step 4: Add an Error alert (Optional)
In addition to an input message, set an error alert to display when the user enters
invalid data into the respective cells. Moreover, add a custom error message.
Application activity 3.6
a.Apply the following data validations in the table below :
1. If the age is not belonging the range of 60 and 75, error message
2. If the Date of birth exceed 1960, provide an error message
3. If the entered country is not RWANDA in UPPER CASE, prompt anerror message
3.11. Pivot tables in Excel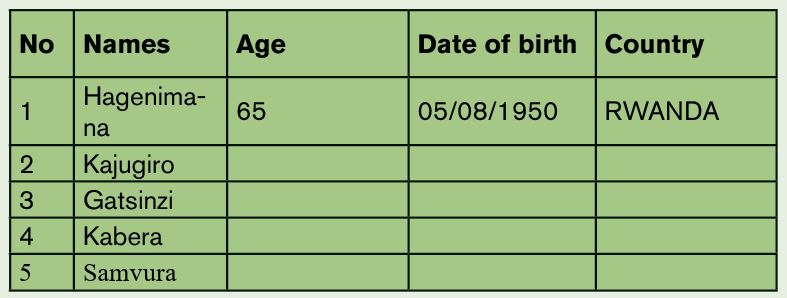
Activity 3.11
By doing a research using the internet or any other resource
answer the following questions
1. What do you understand by a pivot table?
2. Discuss the uses of a pivot table
3. Outline different steps of creating a pivot table
A pivot table is a statistics tool that calculates, summarizes, analyzes and
reorganizes selected columns and rows of data in a spreadsheet or database
table to obtain a desired report. Pivot tables are especially useful with large
amounts of data that would be time-consuming to calculate by hand.
• Uses of a pivot table
• A pivot table helps users answer business questions with minimal effort.
Common pivot table uses include:
• To calculate sums or averages in business situations. For example,
counting sales by department or region.
• To show totals as a percentage of a whole. For example, comparing
sales for a specific product to total sales.
• To generate a list of unique values. For example, showing which states
or countries have ordered a product.
• To create a 2x2 table summary of a complex report.
• To identify the maximum and minimum values of a dataset.
• Creating a pivot table in Excel
• Select the cells you want to create a PivotTable from.• Click Insert tab and then PivotTable.
• Choose where you want the pivot table report to be placed. Select New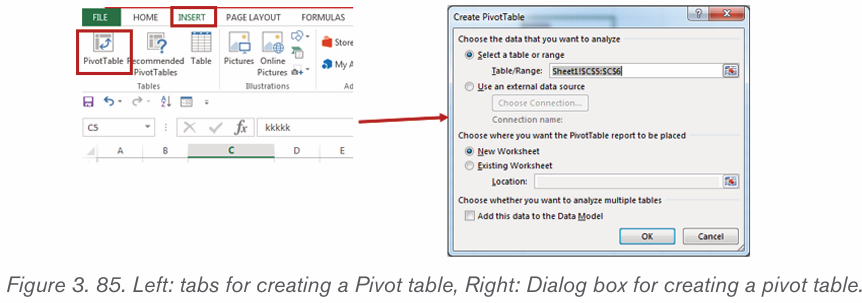
Worksheet to place the pivot table in a new worksheet or Existing
Worksheet and select where the new PivotTable will appear.
• Click OK.
• Choose the fields to add to a report on right pane of the window
• Drag fields between areas below:
• Performing the steps of creating a pivot table
Go through these steps to create a pivot table:
Step1: Select the cells on which to create a PivotTable and click Insert taband then select PivotTable.
Step2: This will create a PivotTable based on an existing table or range. By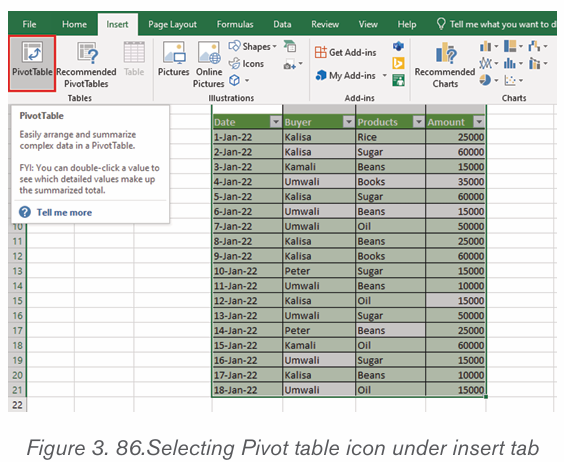
clicking Pivot table tool the Create PivotTable dialog box appears
Step 3: Choose where the PivotTable report will be placed. Select New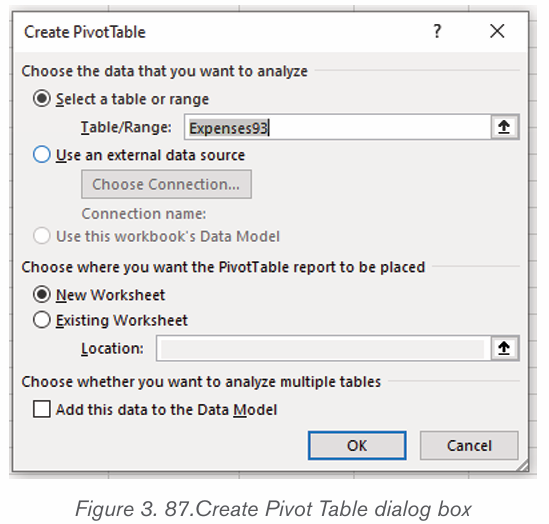
Worksheet to place the PivotTable in a new worksheet or Existing Worksheet and
select where the new PivotTable will appear.
Step 4: Click OK.
Step 5: Choose the fields to add to a report on right pane of the windowStep 6: To obtain a report result, drag product and date filds to values area
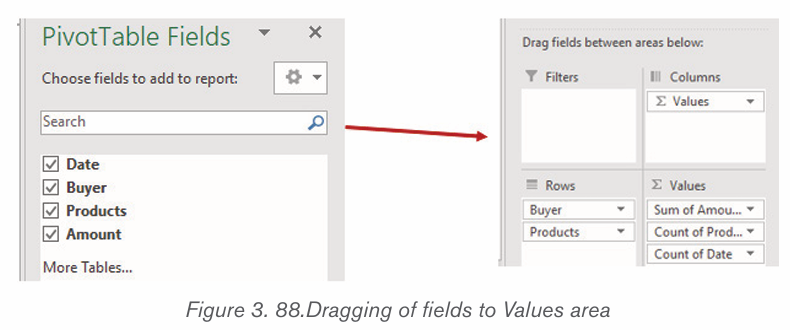
After dragging the fields needed, a pivot table is created automatically as follows:
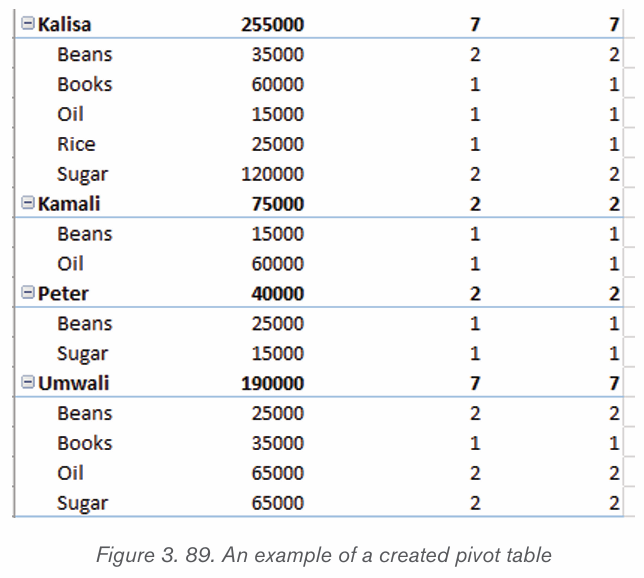
Application activity 3.11
1. You have a list of all students of your class. The list contains the
gender of each student and the district where he/she came from.
You are requested to do the following:
• Separate the list in different sheets, sheet 1 contains the male students
and sheet 2 contains the female students.• Show the number of students by the district where they come from.
3.12. Excel data entry forms
Activity 3.12
1 What do you understand by data entry form?
2. Using internet search, discuss the process of creating Exceldata entry forms?
Excel offers the ability to make data entry easier by using a form, which is a
dialog box with the fields for one record. The form allows data entry, a search
function for existing entries, and the ability to edit or delete the data.
The example below has two fields per record. The form allows up to 32 fieldsper record.
Here below are steps to be performed while creating an Excel data entry form: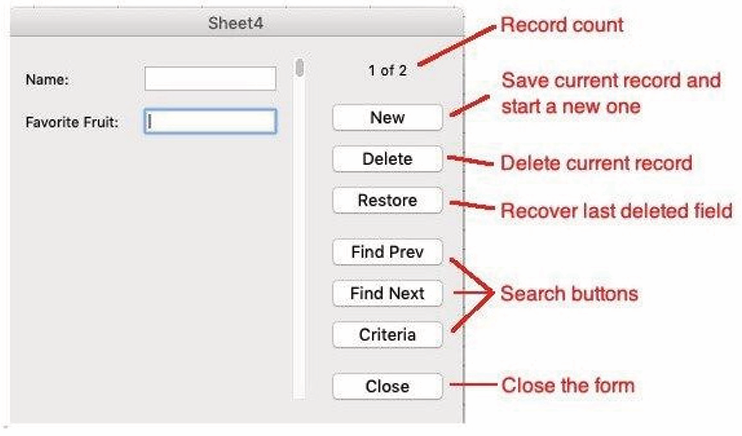
Step 1: On the chosen sheet, highlight the number of columns needed.
Step 2: Click insert tab and then click table icon
Step 3: In create table dialog box, select My table has headers checkbox andclick Ok
Step 4: Change the default column headers, and adjust the width of columns if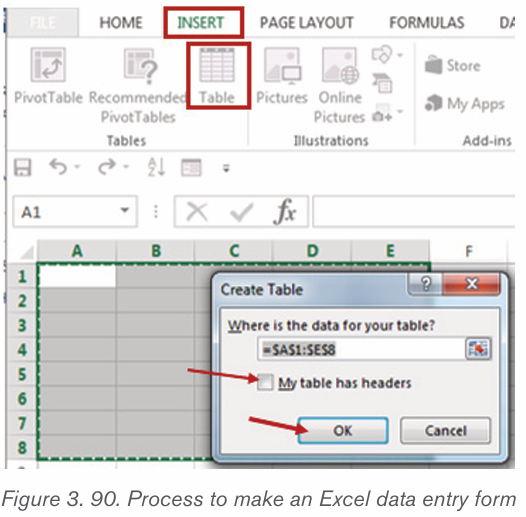
necessary.
Step 5: Click Form Icon of Customize Quick Access Toolbar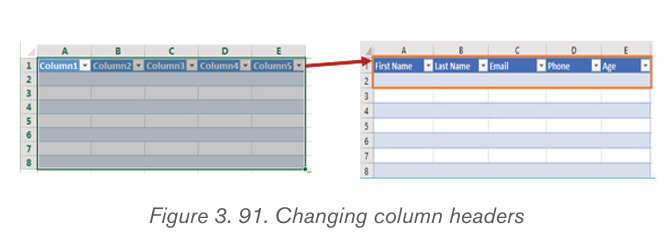
Step 6: The form will appear. The number of columns in the table will match the
number of fields on the form. The column titles in the table will be the field titleson the form. You are now ready to enter data records into the form.
Note that Form Icon is accessed by performing the following steps: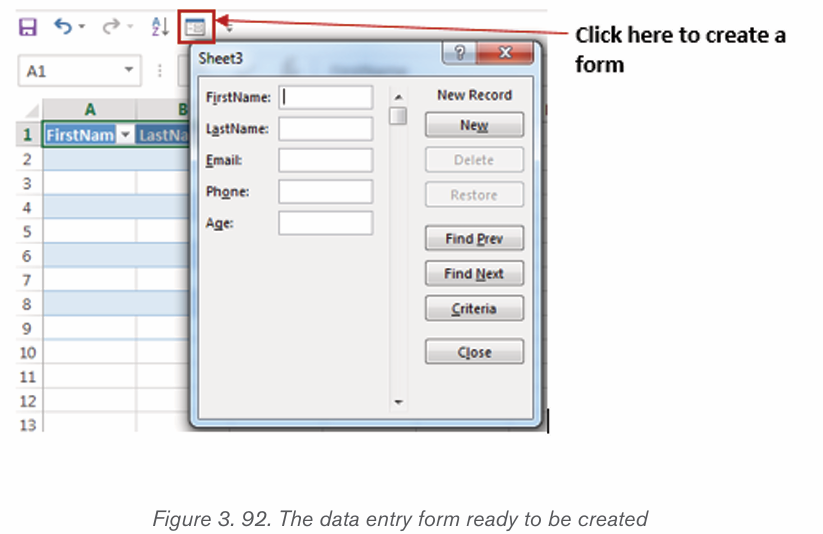
Step1: On Customize Quick Access Toolbar , click More Commands option
Step2: Select Commands Not in the Ribbon and then select Form icon
Step3: Select Add ButtonStep 4: Click Ok Button
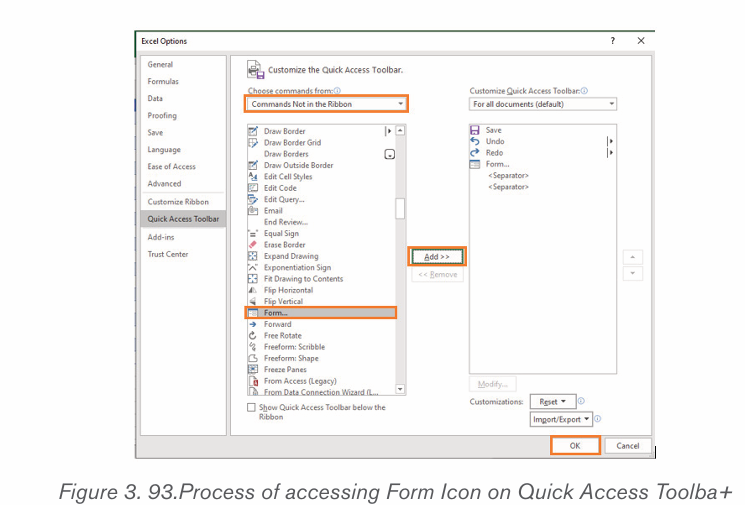
Application activity 3.12
Study the following Excel data entry form and create it:
Skills lab 2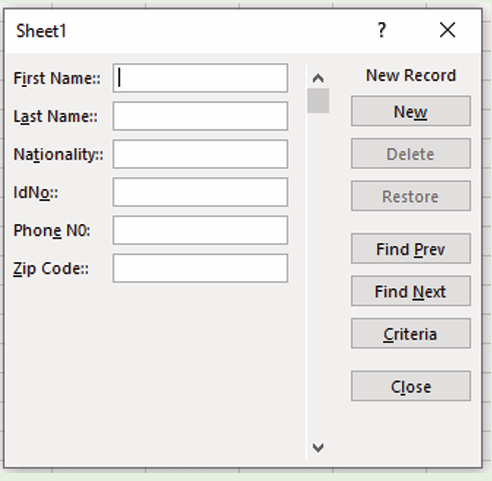
The school organizes an event to welcome new students. All expenses of the
event will be covered by the school. You are requested to prepare a budget of
an event in your class S4. The budget must be done in Ms Excel spreadsheet
with the following:• How many students will attend the event ?Use Excel formulas and functions to do different calculations, also use different
• Categories of expenses and items in event preparation
• Estimated amount to spend on each item of expense and each category
of expensestable styles to make the budget more understandable.
End of unit assessment 3
Q1. Explain the following terms:
a. Loan amortization
b. Data Validation
Q2. Discuss any two financial functions and write their general formats
(syntaxes).
Q3. Discuss any four uses of a pivot table
Q4. Outline different steps of applying conditional formatting using data bars
Q5. On 2nd January, Kamali invested 1,000,000 Rwf in a saving account of
his BPR account at 8% annual interest rate. Calculate the amount of his
savings at the end of year?
Q6. On 10th July 2019, Mukamana took a loan of 3,000,000 Rwf from
Umurenge SACCO.
You are requested to calculate and show the whole process of
reimbursement of Mukamana’s loan from August 2019 to August 2022 atthe interest rate of 18%
UNIT 4: POWER POINT PRESENTATION
Introductory activity
1) Normally, at the beginning of the academic year,
when there is student meeting, the head teacher
used to present the different topics to the new and
old students using different tools. The topic of the
meeting includes the school description, schoolhistory and how the school perform in National Exam.
According to the above information, answer the following
questions:a) Which program the head teacher uses to make1.1Creating a PowerPoint presentation
his/her presentation?
b) List different tools the head teacher uses during
the presentation
c) The presentation contains which kind of content?
d) Which are the main things that you can follow to
make a good and attractive presentation?e) Explain the term audience and presenter
Activity 4.1
The teacher makes a presentation about the use of social media in youth life
and ask students to do the following tasks:
1. By using Ms Word, write a composition of 80-100 words about the
use of social media in Rwanda.
2. Present the findings from above question to the rest of the class
3. Open PowerPoint and paste the presentation from word to the PowerPoint
document
4. Compare the presentation in Word with the one you have created inPowerPoint
A. Key Terms
PowerPoint is a presentation software that allows you to create dynamic
slide presentations. Slideshows can include animation, narration, images, videos, and much more.
A presentation: A presentation is an organized report or message prepared
as talk to an audience, with the help of a computer program such as Microsoft
PowerPoint, Harvard Graphics, etc. a presentation software is used to create
slide shows for that presentation on screen to an audience.
A slide is a single page of information in a presentation created with a program
such as PowerPoint. A presentation is composed of several slides.
A slide show is a collection of pages arranged in sequence that contain
text and images for presenting to an audience. It often refers to a Microsoft
PowerPoint presentation
A PowerPoint presentation can be used for the following purpose:
– Conveying information about an important issue such as disease
control measures.
– Introducing a new idea for a business
– Reporting progress using charts or graphs.– Training by demonstrating how it is done.
A. Launching Microsoft PowerPoint Presentation
STEPS:
1. Click Start button and click all apps.
2. Scroll down and select PowerPoint 2019 or other related versions (or
click Microsoft office and the select Microsoft PowerPoint).3. Select the Blank Presentation as shown in the figure below
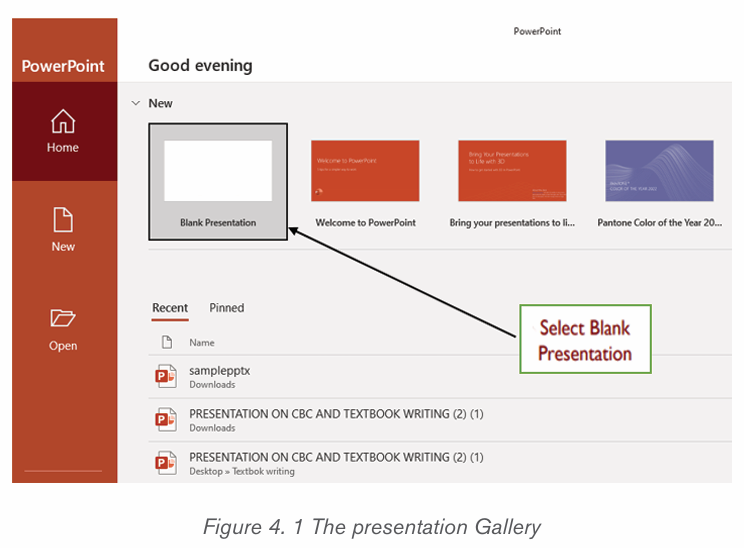
A. Components of PowerPoint environment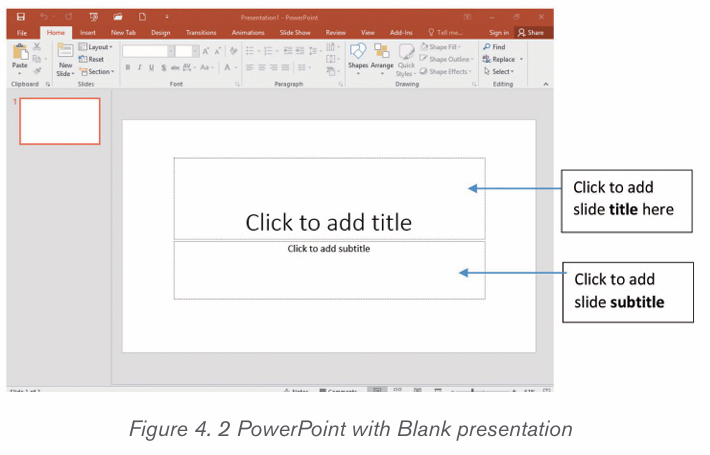
There are different tools in the Microsoft PowerPoint environment which help
the user perform different actions. Those are shown in the screenshot below: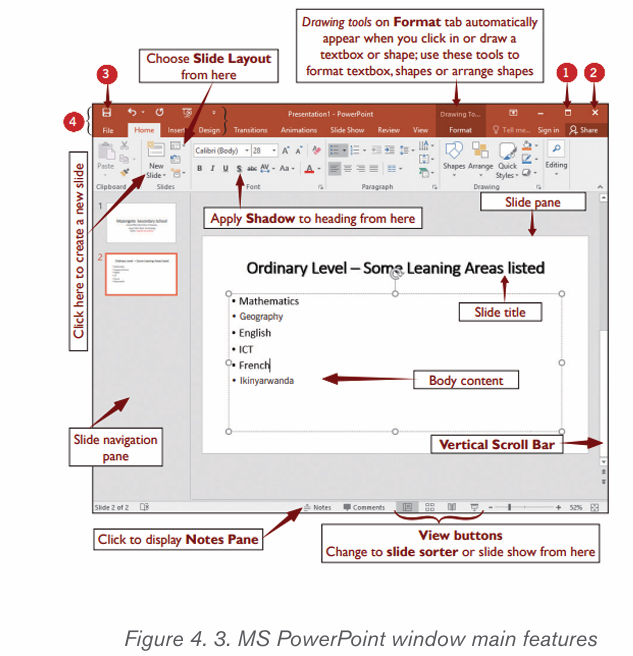
The tools labelled with numbers are the following:
1. Maximize button which makes a window fill the whole screen
2. Close button used to close a presentation
3. The save button
4. The quick access toolbar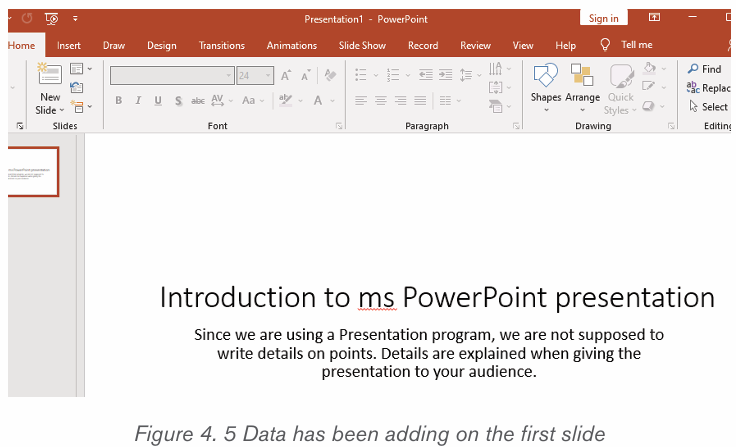
A. Slide layouts
When a new slide is inserted, it will usually have placeholders to show where the
content will be placed. Slides have different layouts for placeholders, depending
on the type of information to be included.
A. Inserting a New Slide
Whenever a new presentation is started, it will contain one slide with the Title
Slide layout, but there is an option of inserting many slides from a variety of
layouts. A new slide is created in the following way:
1. From the Home tab, click the bottom half of the New Slide command.
2. Choose the desired slide layout from the menu that appears.
3. The new slide will appear. Click any placeholder and begin typing to
add text. There is a way to click an icon to add other types of content,such as a picture or a chart.
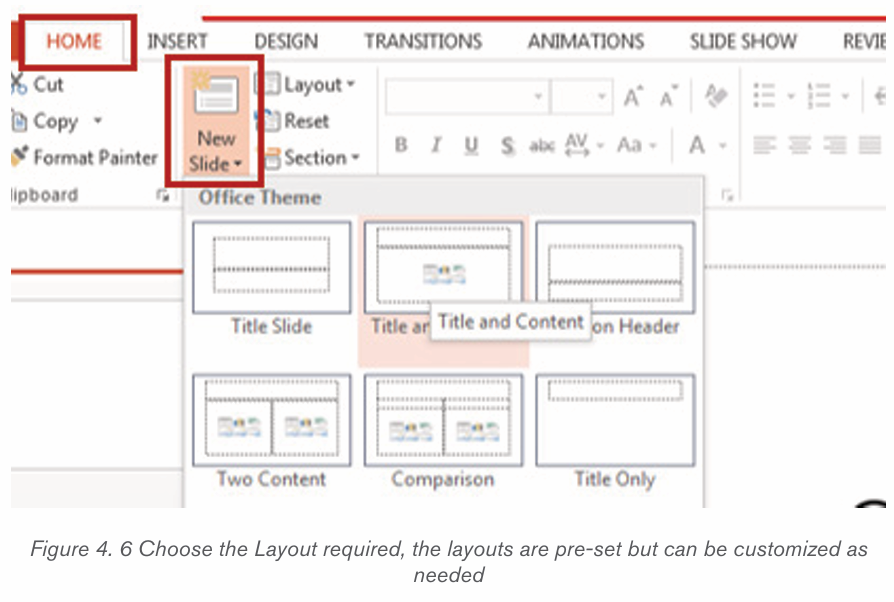
Application activity 4.1
1. lowing slides in that presentation
Slide 1: Title as “Causes of Environmental Problems in Rwanda”. The
text in this slide should be in bullet style and should contain at least the
following main points:
• Population growth and pressure on land
• Declining resources · Over exploitation of natural resources
• Land scarcity
Slide 2: Title as “Rwanda Environmental Management Authority (REMA)”.
It will contain this text:
• REMA is Government organ responsible for execution of
environment related policies and laws in Rwanda.
• REMA designs policies and procedures used to conserve natural
resources, preserving the state of current environment and where
possible reversing its degradation.
• Add more text to give the vision and mission of REMA and its
achievements
Slide 3: Title as “How to protect environment in Rwanda” and should
contain the text about the following points:
• Harvest rain water and conserve all waters for proper use
• Use biodegradable items and practice re-using packaging
products. And others
Slide 4: Title as “Rwanda Environmental Features” should contain the text on:
Natural environment e.g., relief, climate, vegetation
• Natural resources and biodiversity
Note: You can write more text in the slides apart from the points indicated
for each slide
1.1 Organizing slides
Activity 4.2
1. In the presentation created the application activity 4.1. one student
wants to change the arrangements of slides so that the last slide
becomes the first. Explain how he/she will do it.
2. Use the procedure you gave in question 1 and see if it gives the expected
result
3. This same students wants to present that presentation to the class but
does not want to show the third slide. Explain how he/she can do it.
PowerPoint presentations can contain one or more slides. The Slide Navigation
pane on the left side of the screen makes it easy to organize slides. From
there, you can manipulate your presentation. The following are the different
options that can be done using the slide navigation pane:– Duplicate slides: To duplicate a slides, select the slide to be duplicated
in the Slide Navigation pane, do a right-click and choose Duplicate
Slide from the menu that appears. There is also an option to duplicate
multiple slides at once by selecting them first.
– Moving a slide: It is to change the order of slides in a presentation.
Select the slide to be moved (a border will appear around the selected
slide), and drag it to where to reposition it and drop it there. The slide
number sequence will automatically update itself.
– Deleting a slide: To delete a slide select it and press the Delete key
on the keyboard OR right click on the selected slide and select Delete
Slide from the menu.
– Copying a slide: Select the slide to be copied, right click on the
selected slide and select Copy from the menu. The shortcut key Ctlr +
C can also be used to copy a selected slide.
– Pasting a slide: Position the cursor where to paste the slide in the
Slide Navigation Pane and click on Paste or on the paste tool icon. It
is also possible to use the shortcut key Ctrl + V .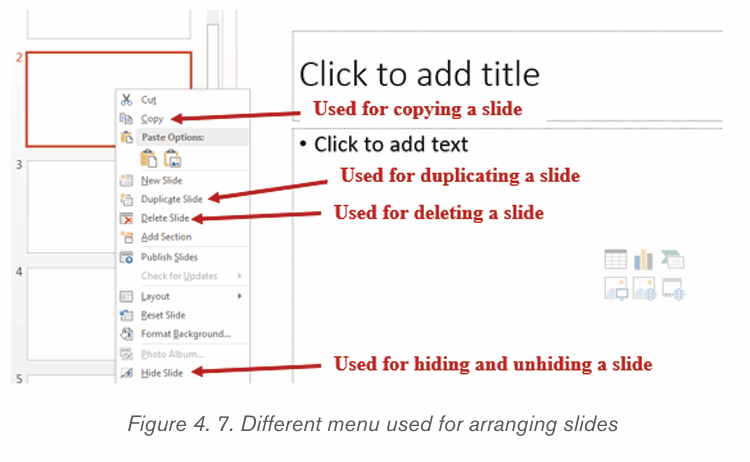
– Hiding a slide: When a slide is not currently needed it can be hidden
by selecting it then doing a Right click and clicking on Hide Slide.
The hidden slide will continue to appear in the slide pane and can be
opened by double clicking it but it won’t appear if the presentation is
opened in the Slide Show mode. To unhide the hidden slide go through
the same process.
– Dividing slides into sections: Sections are subdivisions in a
PowerPoint presentation slide used preferably for bigger presentations
that can be logically grouped. Slides in the same group should be
logically related so as to facilitate their understanding during presentation
or while reading them. Putting slides into sections can also be done
when slides are to be presented by different people thus each person
presents his/her section.
To create a section in a PowerPoint presentation, do the following:
1. Select in between the slides where to insert the section or the slide
behind which to insert the section
2. Do a right click and click on Add Section in the provided options.
3. Rename the section by selecting its default name, do a right click and
click on Rename. The default name of a section is Untitled Section.
4. Write the new name and click on the Rename button
A created section can be removed by selecting it, doing a right click and
choosing Remove Section. It can be moved by choosing the Move Section Upor Move Section Down option.
Slide Sorter View is good to use when organizing your slides. It allows to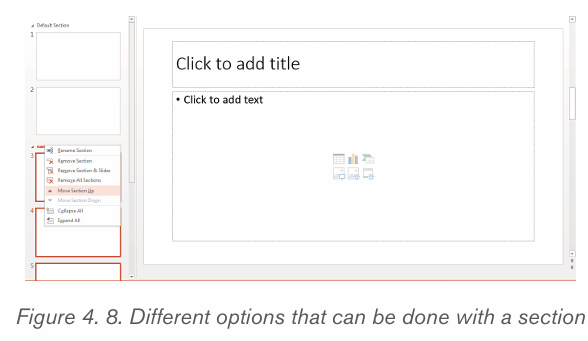
view all slides in a grid arrangement and therefore makes it easy to find a slide to
move (or do any other operation) and easily identify where to place it. To accessthis view:
– Click on the View tab then– Click on Slide Sorter too.
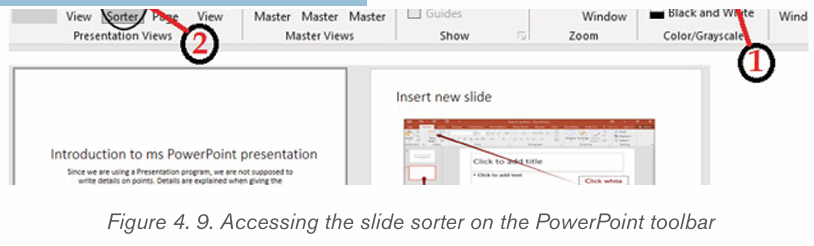
Application activity 1.1
1. Create a PowerPoint presentation on “Computer software” with 3 dis
tinct slides in the presentation where each slide is about the following:
a. Word processing software
b. Spreadsheets software
c. Presentation software
2. Move second slide to the third position
3. Add 2 more slides to your presentation, 1 slide is about the differ
ence between Word Processing and Spreadsheet, the last slide is
about the importance of Presentation software.
5. Hide the fourth slide of your presentation6. Save the presentation as My first presentation
1.3 Apply Design themes and format background
Activity 4.3
Open My first presentation created while doing the
application activity 4.2. Make it more attractive by
applying design. Save changes and run the slide show
1.1.1Apply design theme in a presentation
A Theme gives the slides a consistent appearance throughout the presentation.
Themes contain color schemes with custom formatting, styled fonts, and layouts.
When applying a design template to the presentation, the slide master and
color scheme of the template replaces the original blank slide.
1. Select the Design tab on the Ribbon, then click the More drop-down
arrow to see all of the available themes.
2. Select the desired theme.
3. The theme will be applied to the entire presentation.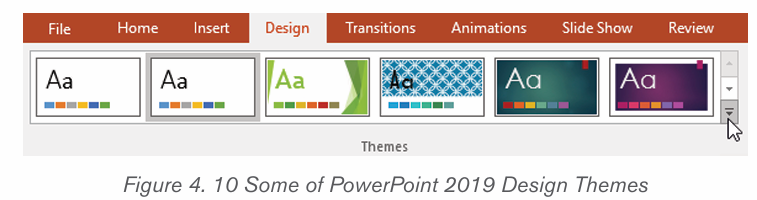
Once a theme is applied to the slides in presentation, another option is there to
select a variant for that theme from the Variants group. Variants use different
theme colors while preserving a theme’s overall look.
The following figure is a sample of a slide on which a design theme has been applied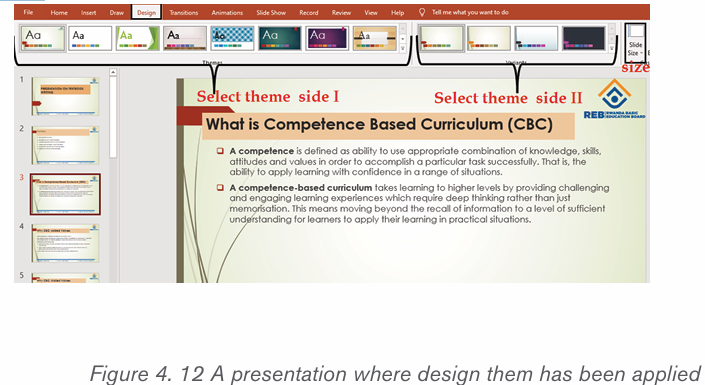
To format the slide background
To format a slide is to change the appearance of the slide and or its contents.
Backgrounds can have a solid, gradient, pattern, or picture fill. Use the
steps given below and apply any color you want.
Step1: Select the Design tab, then click the Format Background command.
Step2: The Format Background pane will appear on the right. Select the
desired fill options.
Step3: The background style of the selected slide will update.
Note: Apply to All means to apply the same background style to all slides in
a presentation.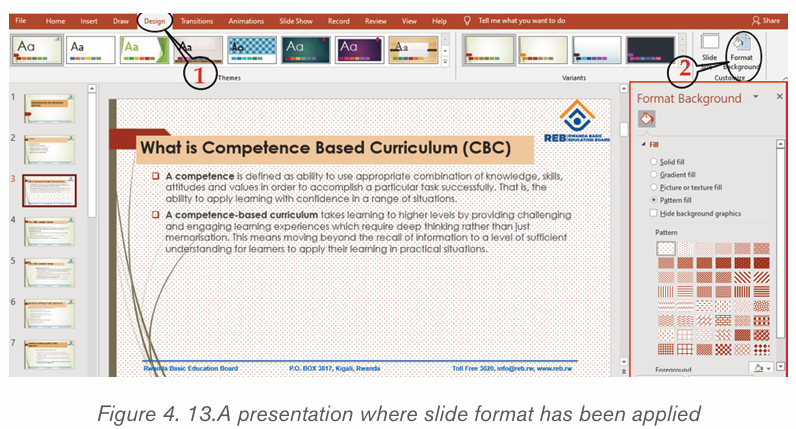
1.1.1.Adding notes and comments, Inserting header and footer
i) Adding comment
In PowerPoint presentation, a comment is an explanation that is attached to a
text or an object on a slide, or to an entire slide. To add a comment in a slide, go
through the following steps:
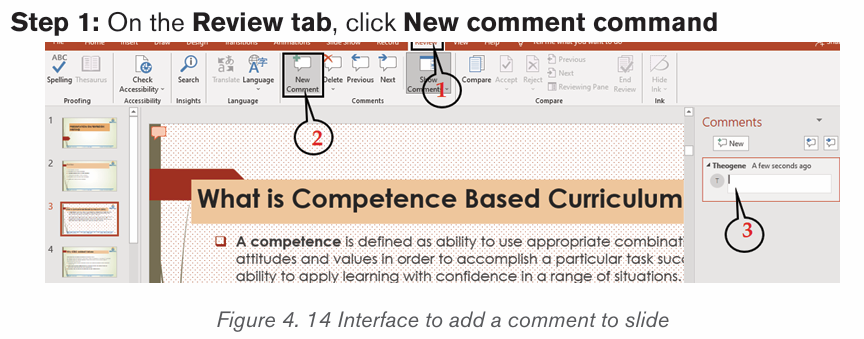
Step 2. Write the comments in the provided space as visible in the zone No 3
of the above image
Note: Comments can be added to a PowerPoint presentation by using a simple
method of clicking at the Comment option located at the bottom middle of an
opened PowerPoint window.
i) Adding notes
In a PowerPoint presentation Notes are words added to a presentation as
reference and only visible to the one presenting the slides. They serve as
additional information for the presenter that can be read for guidance as the
presentation goes on
To add notes to a presentation, do the following:
1. On the View menu, Click Normal
2. Select the thumbnail of the slide to add notes to
3. The notes pane will appear under the slide. Click where it says Click toadd notes and type whatever notes depending on your choice.
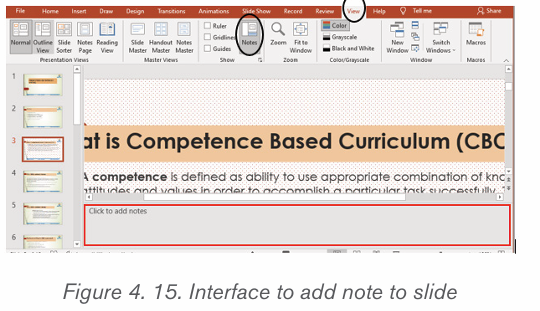
i) Insert header and footer
Header and footer in a presentation is the top and bottom parts of the slides.
These include the slide number, text footer and date. To add a header or footer
follow these steps:
1. Click Insert then go to Header & Footer
2. In the box below Footer, type the text to use as footer such as the
presentation title
3. Check Date and time to add that to the slides
4. Check Slide number to add to the created slides5. Click on Apply or Apply to all if all slides are to have the same header or footer
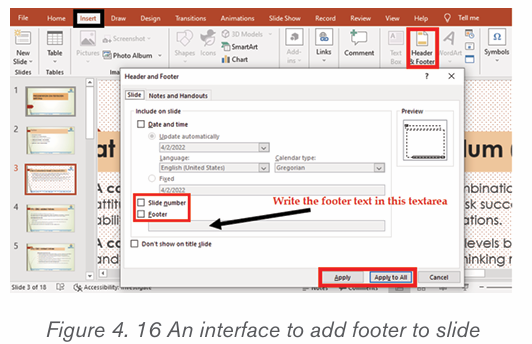
Application activity 4.3
Create a PowerPoint presentation “Understanding Gender Equality” contai
ning at least 5 slides and do the following:
1. Change the theme of the presentation to “Organic”.
2. Give this presentation a picture background
3. Change the background of the presentation to “Pattern Fill”.
4. Create a new section that you name “Gender equality in the develop
ment of Rwanda” with 5 slides. This section should have “Main event” as
the theme of the presentation.
5. Apply new theme with color and font to the working presentation
6. Add notes and comments to the created slides that will help you while
presenting
7. Add header as “Understanding Gender Equality”
1.1.Inserting objects in a presentation
Activity 4.4
1. What are types of objects that can be inserted in a presentation?
2. Give the benefits of adding objects in a presentation
3. Differentiate a presentation with objects to a presentation without objects
1.1.1Inserting a picture
An image is the actual picture or mental picture of something. Adding pictures
can make a presentation more interesting and attractive. A picture can be inserted
directly from a computer or from the internet.
i) Inserting pictures from the computer
To insert pictures in a slide do the following: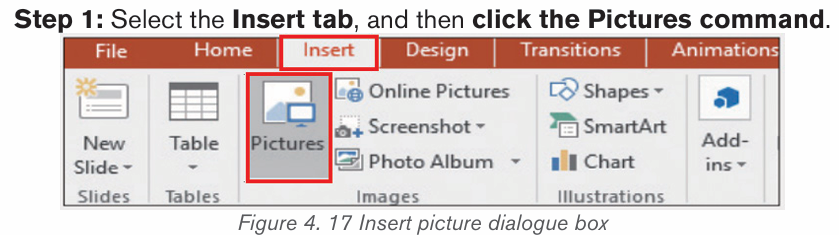
Step 2: Browse in the computer folders where the image is located and select
one image and click Insert.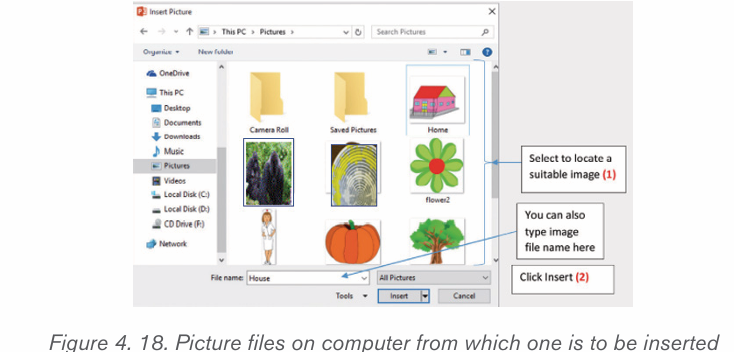
Note: It is also possible to insert image in a slide by using a Picture placeholder
which is found in every slide.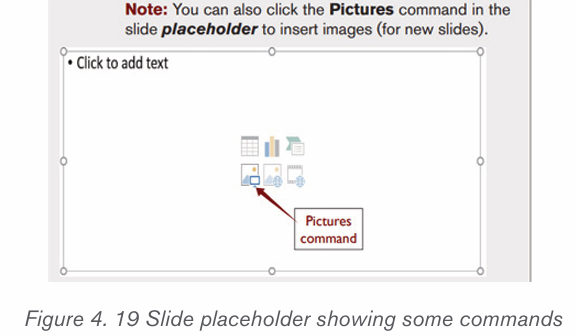
i) Inserting online pictures
In case a desired picture is not available on a computer, a suitable picture can
be found online and then inserted in a presentation. Online pictures are used
instead of ClipArt that exist in earlier versions of the program.1. Under the Insert tab, click on the Online Pictures button
1. In the Search box, type the word Classroom, and then press the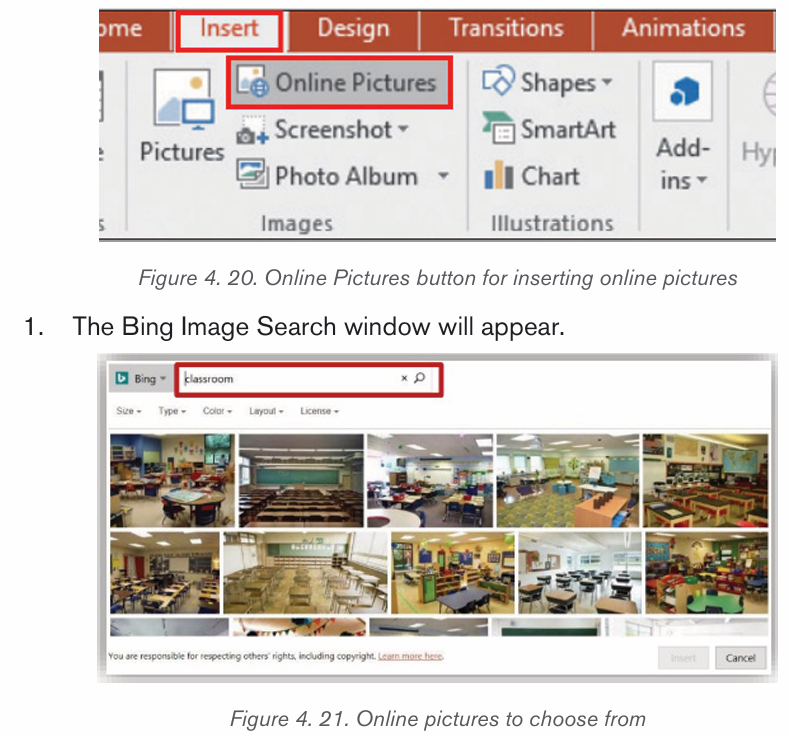
Search icon. A variety of online images associated with the search term
classroom»» will appear.
2. Scroll through the Pictures window to find the desired image
3. To insert the image, place the mouse pointer on the image and then clickon the left mouse button twice.
1.1.1.Inserting a Table
A table is made of rows and columns. Data or information can be arranged
using these rows and columns. Two methods can be used:
– Create and format a table within a presentation.
– Import a table from Word or from Excel
Step 1: Select the slide in which the table will be added.Step2: On the Insert tab, select Table.
Step 3: Select the rows and column to insert and click, in this case the table is created.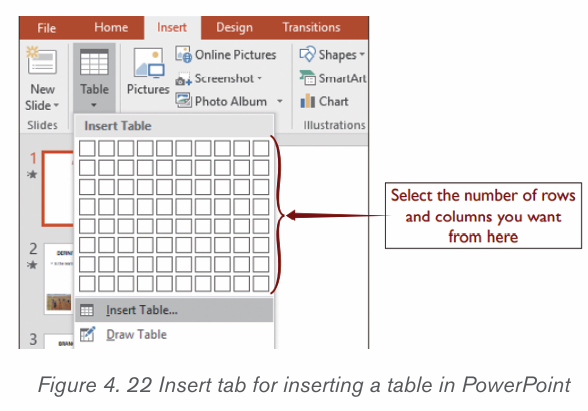
Or click on the Insert Table command that appear below the many cells as
shown in the image above then in the dialog box write the number of rows andcolumns then click OK.
1.1.1.SmartArt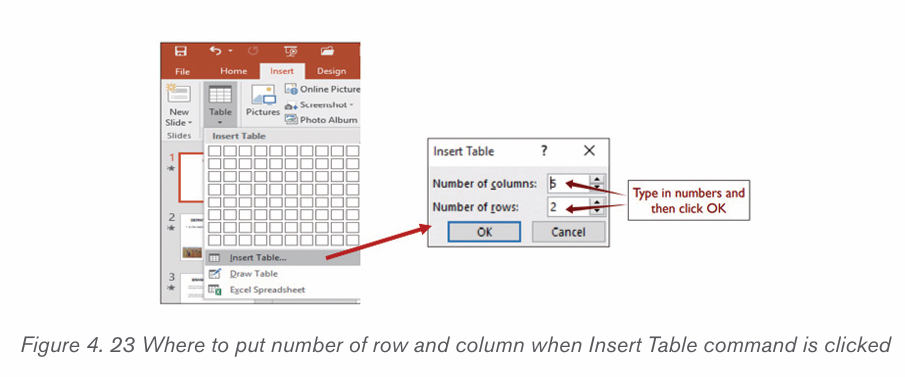
SmartArt is a picture used to communicate information in many different ways.
It is an option that allows the user to create diagrams easily.
Use the steps given below to insert a SmartArt graphic to the presentation.
Step 1: Open a file presentation and insert a new slide where a SmartArt is needed.Step 2: On the Insert tab, in the Illustrations group, click SmartArt.
Step 3: In the Smart Graphic dialog box that displays, click the type and desired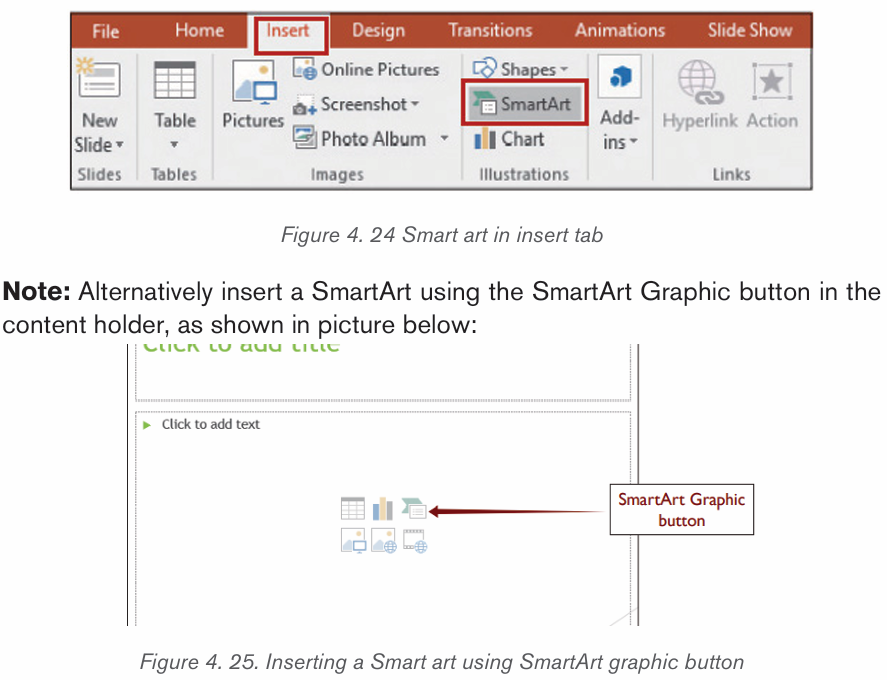
layout. In this case, let create a hierarchy of officers for any school.
Step 4: Enter the text by either: Clicking in the text pane (left) and then type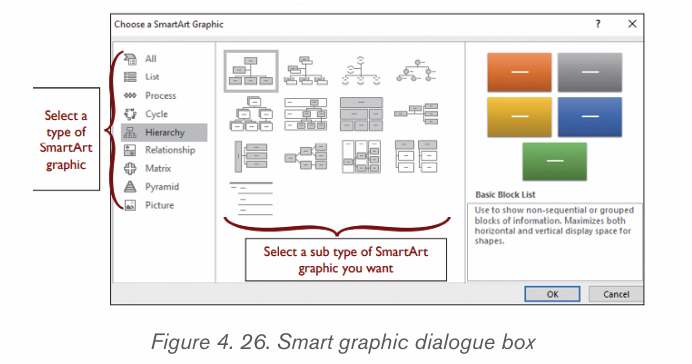
the text or clicking directly in the Smart Graphic and type the desired text.Afterwards save it.
1.1.1.Shapes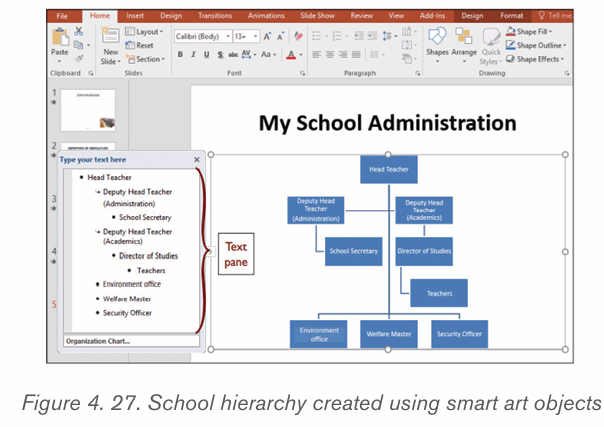
A shape is an outline form of an object. In office applications such as Microsoft
PowerPoint, shapes such as boxes and circles can be added to slide show
presentation. Use the steps given below and insert any desired type of shape.
Step 1: Click on Insert tab.Step 2: Click Shapes from the Illustrations group.
Step 3: Select a shape such as a rectangle and then click and drag to draw the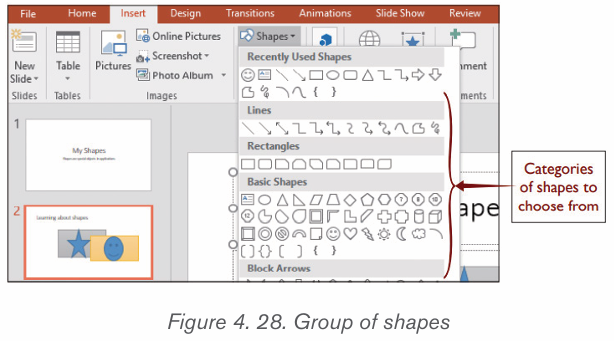
shape in the desired place. After drawing a shape, text, bullets and numbering
can be added to it.The change of fill, outline and other effects can be applied on the Format tab
1.1.1.A chart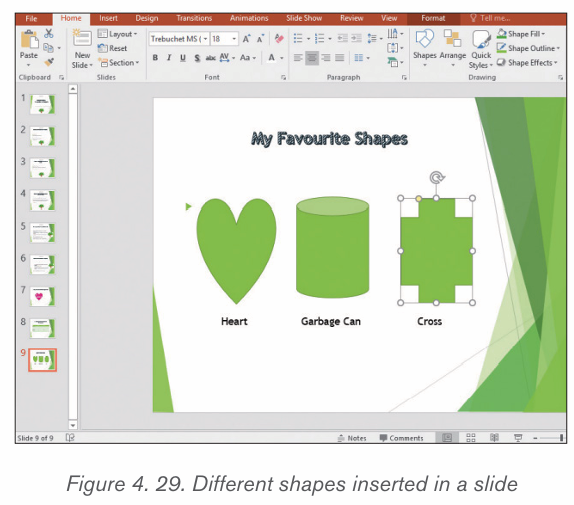
This is a pictorial representation of numerical data. There are many charts that
can be created in a slide, but common charts frequently used are: column charts,
line charts and pie charts.
Step 1: Insert a new slide (Title and content layout)
Step 2: Click the Chart icon in the content holder to generate a column chart.Alternatively click on the Insert tab then click Chart tool in the Illustrations group.
Step 3: The column chart appears together with a data sheet that can be edited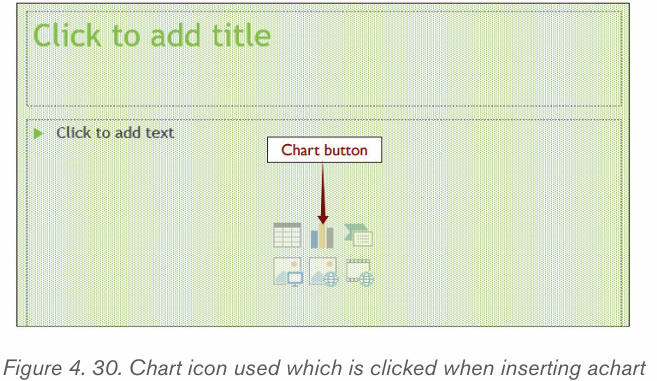
to suit the desired chart.
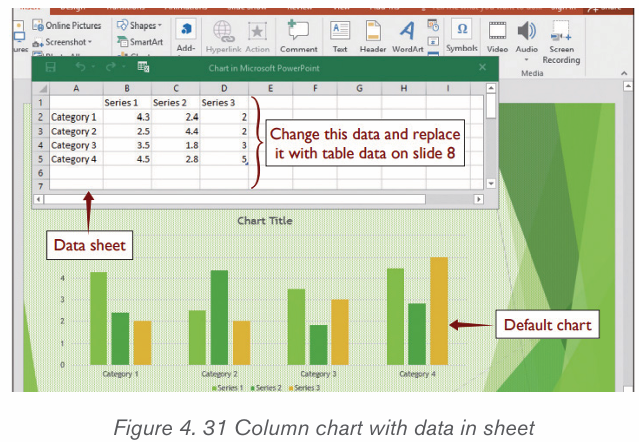
Step 4: Edit data sheet by replacing default data with desired data.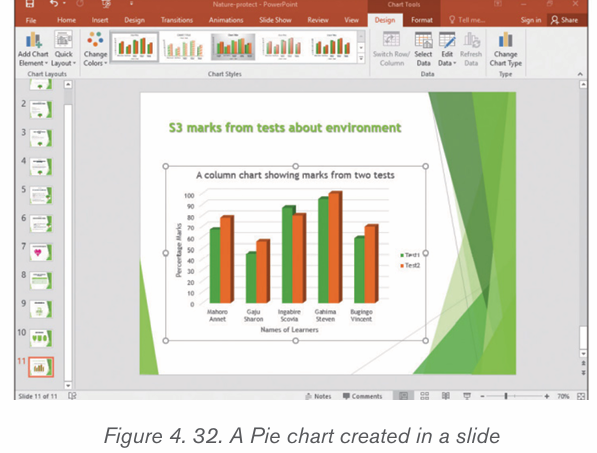
1.1.1.Media clips
Media clip is a small segment of an electronic media either an audio clip or a
video clip
i) Audio clip
To insert audio clip, follow the steps given below:
1. Select the slide where to insert an audio clip.
2. On the Insert tab, in the Media group, click arrow under Audio, andthen click Audio on My PC.
1. In the Insert Audio dialog box, select a folder with the desired audio then select the file.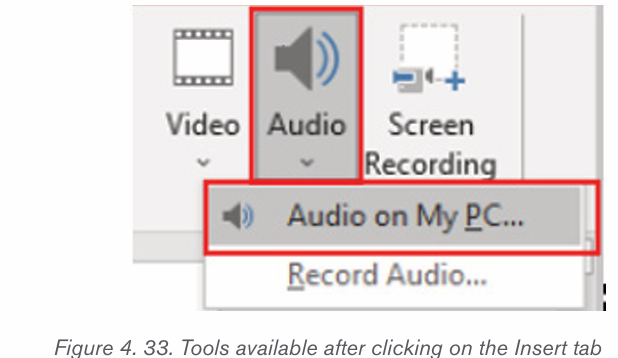
2. Click on Insert button to insert the audio.
The slide where audio has been inserted will appear as shown below. Play using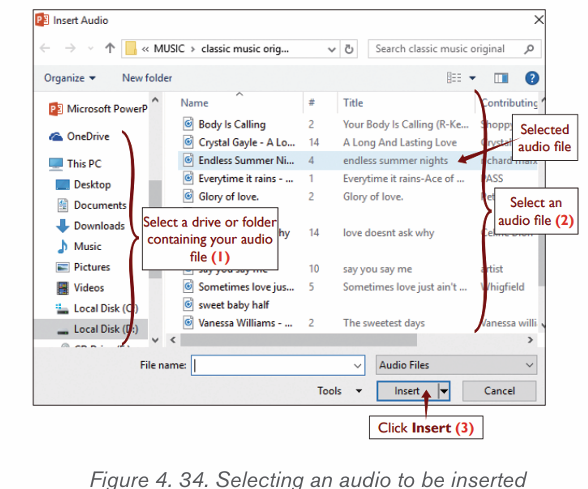
the media buttons displayed.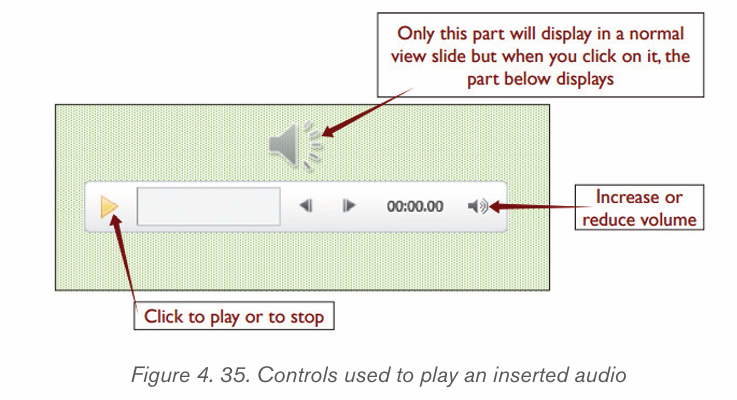
i) Video clip
There are two ways to insert video which are by linking and by embedding a
video directly from the PC into the presentation. Use the following steps below
to insert a video clip in a presentation.
1. Select the slide where to insert a video clip.
2. On the Insert tab, in the Media group, click arrow under Video, andthen click Video on My PC.
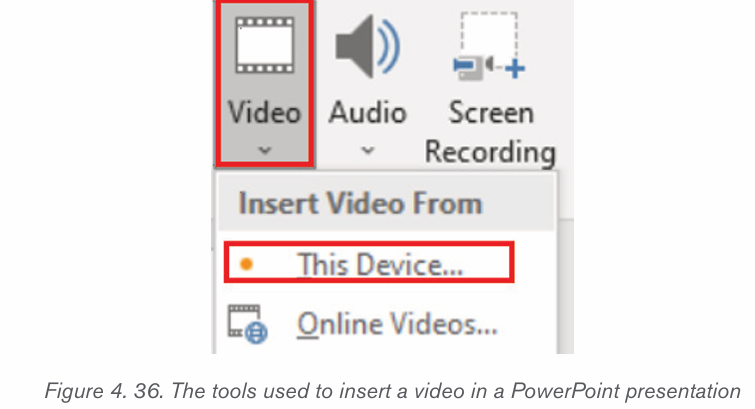
1. In the Insert Video dialog box, click the desired video from a specific folder. Click Insert.
1. In the Insert Video box, click the desired video from a specific folder.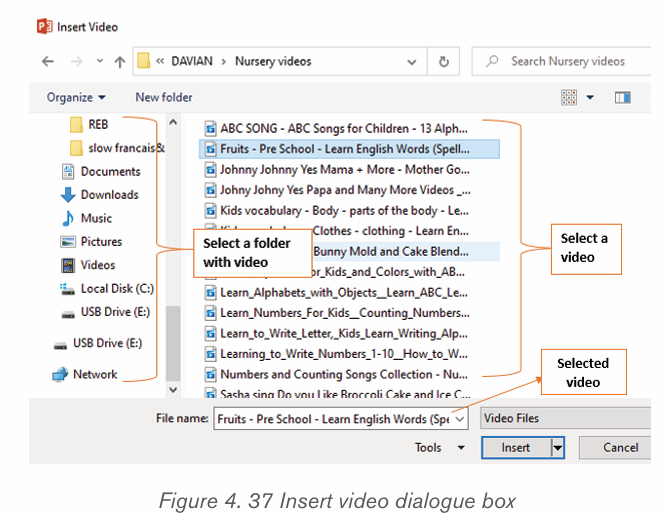
Click Insert.A slide with an embedded video will appear as shown below:
Application activity 1.1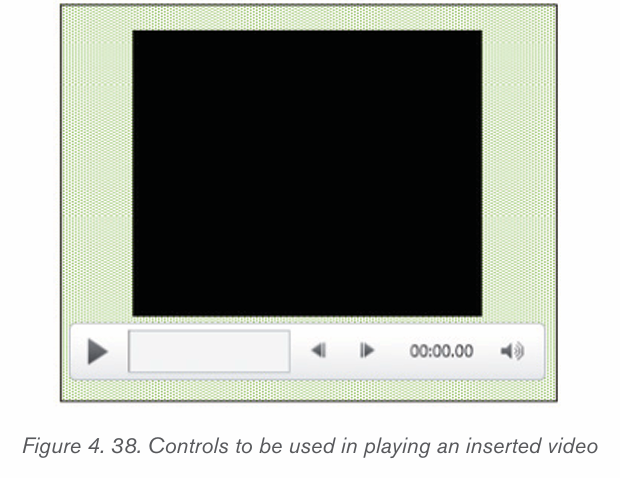
Create a presentation of your school description. Animate the presentation
as follow:
a) The title to “Fade”,
b) The text to “Appear”
c) The image to “Pulse”
1. Insert an audio from your computer into the next one slide of your
presentation
2. Add new slide and insert a SmartArt graphic that will present the
hierarchy of staff in. your school.
3. Basing on the information given by the school secretary, insert in
the last slide of your presentation, the table showing separately thenumber of boys and girls in O’ level
1.1.Applying animation in a presentation
Activity 1.1
1. Explain the terms animations and transitions in a presentation
1) Open an existing presentation from your computer and apply
animations to all text and pictures by clicking on the ANIMATIONS
tab then clicking on one transition. Examples of transitions are shownin the images below:
Animations are presentation features that give motion or life to text or object in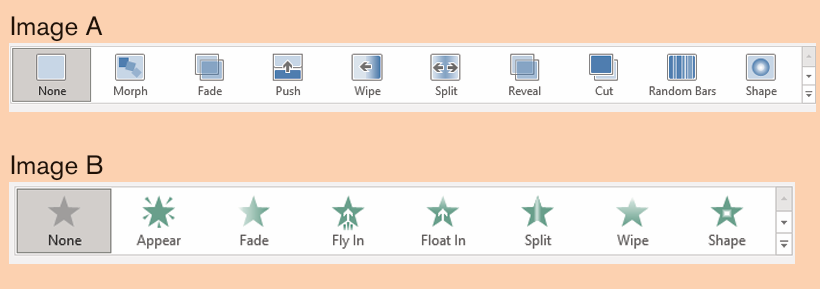
the slide show. Animation effect can be added to text or graphics objects and if
well applied, brings excitement and increase the audience ability to understand
a message.
A. To apply animations to text or objects in PowerPoint presentation
1. Select a text or object to animate.
2. On the Animations tab, in the Animation Group, select one desired
animation e.g. fade, Fly in, etc. Apply Timing to animation, that is, inTiming group, increase or reduce the duration or delay of the animation.
A. Applying slide Transitions in a presentation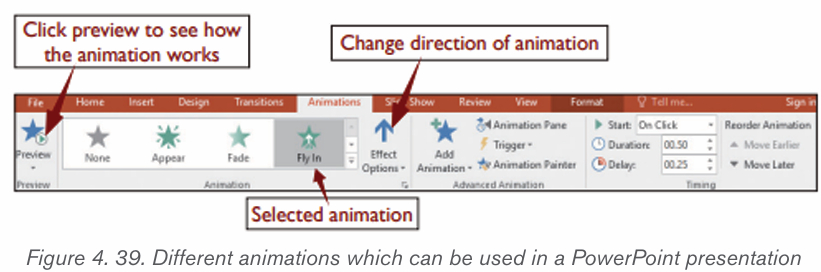
Slide transitions are the effects that occur when slides are moving from one
slide to the next during a presentation. The presentation creator can control the
speed, add sound, and customize the properties of the transition effects.
Types of transitions: In PowerPoint 2019 the main slide transitions are subtle,
exciting and dynamic content.
a) In Subtle transition: Simple transitions are used to move from one
slide to another
b) Exciting: Additional visual effects are used to catch the eye of the
audience
c) Dynamic content will move only the placeholders, not the slidesthemselves.
Follow the steps given below for applying slide transitions: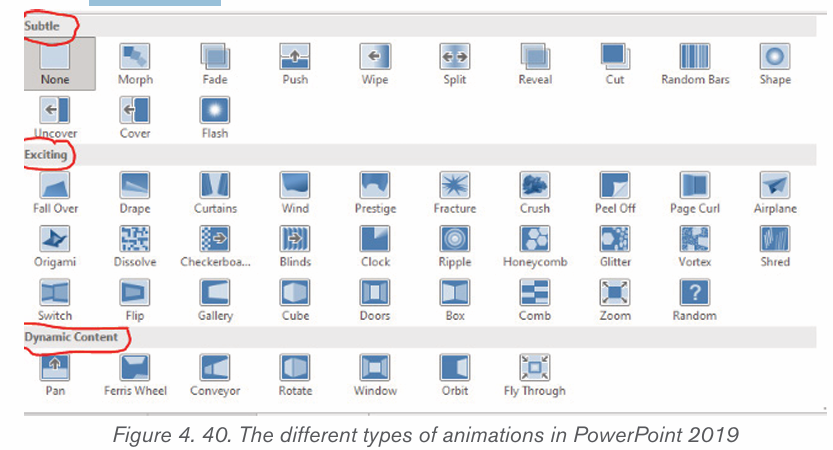
1. Select the desired slide from the Slide Navigation pane.
2. Click the Transitions tab, then locate the Transition to This Slide group.By default, None is applied to each slide.
1. Click a transition to apply it to the selected slide. This will automatically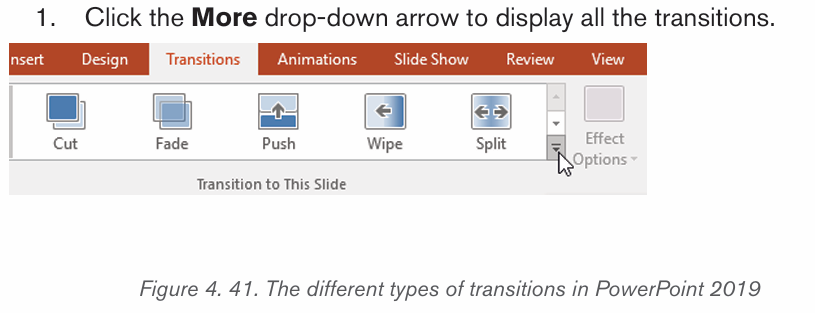
preview the transition.Note: The Apply To All command in the Timing group is to apply the same
transition to all slides in the presentation. Keep in mind that this will modify any
other transitions that had been applied before.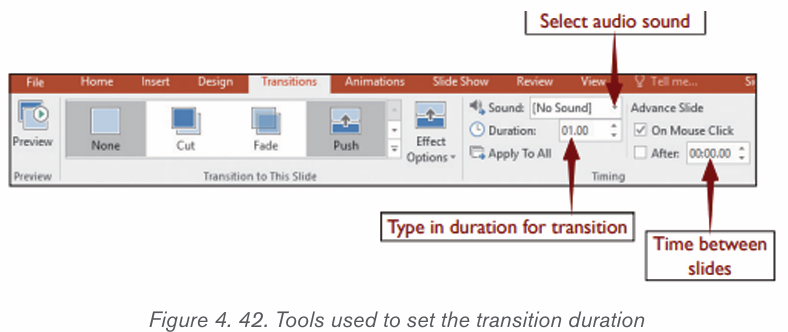
Preview a transition: To preview the transition for a selected slide at any
time use either one of these two methods:
1. Click the Preview command on the Transitions tab.
2. Click the Play Animations command in the Slide Navigation pane.
A. Modifying transitions
i) To modify the transition effect, follow these steps:
1. Select the slide with the transition to modify.
2. Click the Effect Options command and choose the desired option.These options will vary depending on the selected transition.
1. The transition will be modified, and a preview of the transition will appear.
i) To modify the transition duration, follow these steps:
1. Select the slide with the transition to modify.
2. In the Duration field in the Timing group, enter the desired time for the
transition. In this example, the time will be decreased to half a second or00.50 to make the transition faster.
A. To add sound, follow these steps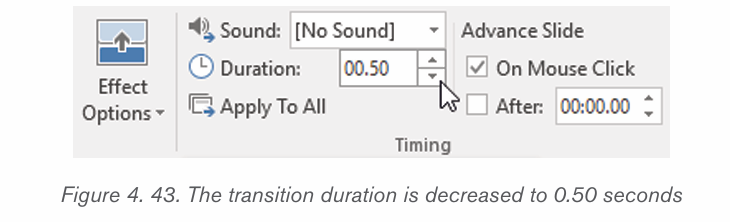
1. Select the slide with the transition to modify.
2. Click the Sound drop-down menu in the Timing group.
3. Click a sound to apply to the selected slide, then preview the transition
to hear the sound.
Sounds are best used in moderation. Applying a sound between every slide
could become overwhelming or even annoying to an audience when presenting
the slide show.
A. To remove a transition, follow these steps
1. Select the slide on which the transition is to be removed.
2. Choose None from the Transition to This Slide group. The transition
will be removed.
To remove transitions from all slides, apply the None transition to a slide, thenclick the Apply to All command.
Application activity 4.5
Create a presentation on «Taxation system in Rwanda» which
contain 5 slides and do the followings:
1. Make the Font type =”Candara” ; Font Size =”24” and Paragraph
groups available in PowerPoint
2. Make the slide titles and each bullet in every slide have the Fly inanimation.
3. If the title of the slide changes, change the sound accompanyingthe projection of the title (not the whole slide)
4.End the presentation with a visible and audible clap of the hands
5. Change the transition Duration to 2.00.
6. Use the Apply to All command to apply your changes to every slide.
7. Save your work
Skills lab 3:
You are a businessman and wants to engage in a new business.Prepare a business plan for that business and present it to others
End of unit assessment 4
Q1. Create a presentation of six slides on the topic of ICT in Accounting in
Rwandan context
Slide 1: Should have the title of the topic, and Name of presenter
Slide 2: should have the definition of ICT and accounting terms
Slide 3: Should have the impacts of ICT in Accounting
Slide 4 and Slide 5: should have the list of ICT tools in accounting
Slide 6: should have the thanks message
Save the presentation as question 1 and run the presentation
Q2. Create a presentation containing the table below in the first slide. In the
second slide and put a graph summarizing the data from the table in the firstslide. Save the presentation as Question 2
Q3. Create a presentation about Deforestation in Rwanda following the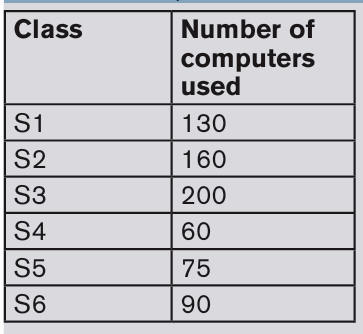
procedures below: –
•In the first slide: Topic and definition– • In the second slide: Importance of Deforestation
UNIT 05 : DATABASE MANAGEMENT WITH ACCESS
Introductory activity
The management of TERIMBERE Sacco cooperative located in GICUMBI
District, would wish to hire a qualified consultant in ICT who will design an
efficient Database which will help them to shift from a tradictional paper
based data recording to a Computerized database management system.
Below are some main services offered and transactions performed by
different concerned staff:
a. Creation of a new customs account using cooperative customer form
b. Money-deposit by customer using cooperative customer bookc. withdraw money from customer account using cooperative customer book
As a student in ICT in Accounting, you are requested to :
i. Suggest different ways that can be used to keep the above information.
ii. What is the benefit of keeping that information in a computerdatabase compared to keeping it on a paper?
iii. Which Office program to use to create that database?
5.1 Understanding database
Activity 5.1
1) What do you understand by the term Databaseb) Give examples of databases you know in the society you live in.
In our information society, record keeping and data processing using data
base has become an important aspect of every organization such as Hospital,
School, Universities and Governments. Databases are used all the time, often
without knowing it. For example, withdrawing money from the Bank’s ATM
requires the existence of a database where information about clients and theirbalance is kept.
5.1.1. Database concepts
A. Definitions
a) Database
A database is an organized collection of related data so that its contents can
easily be accessed, managed, and updated. It is considered to be organizedbecause the data is stored in categories that are accessible in a logical manner.
b) Data
Data are unprocessed raw facts that include text, number, images, audio, and
video. The data are useless for decision-makers until they have been processedor refined in some manner.
c) Information
Information is data that has been processed, refined and given in the format that
is suitable for decision making or other organizational activities.
For example: Report about student fee paid is useful information for financesection.
d) Database management
Database management refers to a set of activities performed on the database.Some of these activities are :
Insertion of new records in tables are,
Deletion of unnecessary records,
Updating records if the information is changed,
Searching for records according to the given criteria whenever needed.
e) Database Management System (DBMS)
The Database Management System (DBMS) is an application software that
enables users to define, create, and maintain the database and which provides
controlled access to this database.
The DBMS receives requests (queries) encoded in SQL and translates those
queries into actions on the database.
A database system comprises of five major components :
1. Data: The database contains both the operational data and the meta
data (the data about data).
2. Hardware: this consists of the secondary storage (hard disk) on which
the database resides together with the associated devices.
3. Software: Software refers to the collection of programs used within
the database system. It includes the DBMS software the application
programs, together with the operating system, including network software
if the DBMS is being used over a network. The application programs that
allow users to store information in an ordered manner for timely and quick
retrieval is called Database Management System (DBMS).
4. Procedures: These are the instructions and rules that govern the design
and use of the database. This may include instructions on how to log on
the DBMS, make backup copies of the database, and how to handle
hardware or software failures.
5. People (users): This includes the database designers, database
administrators (DBAs), application programmers and end users.
Databases are useful. For example many computing applications deal with large
amounts of information; they have become an essential component of everyday
life in this modern society. Database systems give a set of tools for storing,searching and managing this information.
A. Importance of database
– A database enables to put data on the disposition of users for consulting
or updating
– The database should manage the privileges granted to its users.
– A database can be local in one machine just used by one user or
distributed in many machines accessible by many users through a
network (sharing of data).
– The main advantage of using database is its possibility to be used
simultaneously by many users as per the image below :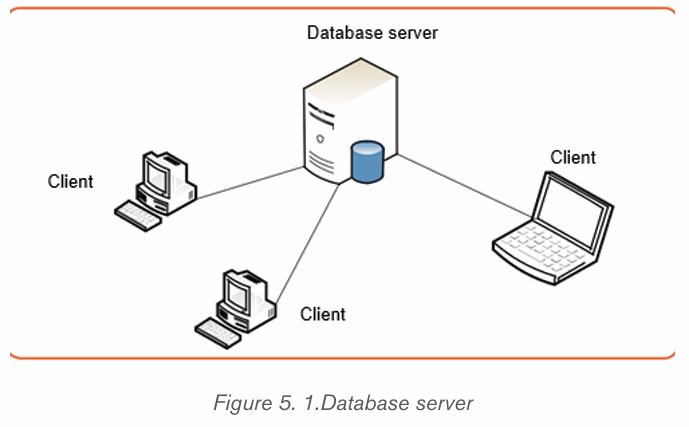
5.1.2. Database Approaches
A. Paper based database
This is a kind of database where information is kept on papers. Keeping a
database on papers makes its management difficult and the size of paperscumbersome.
Paper based database presents the following disadvantages:
Papers can be lost, damaged over time or due to calamities like fire and flood
If there is change in the stored information the hard copies are hard to update
or may even rewriting the information on a new copy having the new updates.
Compared to information kept in a computer, paper-based databases aredifficult to copy and search.
A. Computerized database
When a database is stored electronically on a computer and can be manipulated
using a computer, it is called a computerized database. Computerized databasescan be of different types:
a) Traditional File Processing Systems (TFPS) approach
This is an approach which was used before the invention of modern Database
Management Systems (DBMS) but this approach was difficult to use as
It required advanced knowledge and to use it one had to have advanced
programming knowledge which was not easy for a common user. Users had
to write application programs to store data in form of files on the computer
permanent storage device (Hard Disk) and each application program written by
a user had to define and manage its own data.
Compared to manual management of information, the Traditional File Processing
presents the following advantages:
• Simplicity: the design of file processing is more simple than designing
a database
• Efficiency: file processing cost less and can be more speedy than
database
• Customization: you can customize file processing more easily and
efficiently than database because files are related with the application
and it has all the data needed for that application.
In File-based processing, for each database there is a separate application
program as shown by the following figure: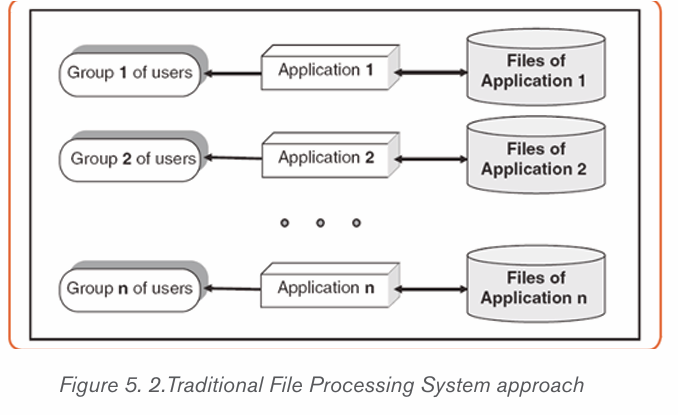
Traditional File Processing System presents the following disadvantages :
• Separation and isolation of data : as data is isolated in many files,
it is not easy to have access to data.
• Duplication of Data : because of the decentralized management,
data may be scattered on different computers and this has as
consequences a misuse of storage space as data is repeatedly stored
in different locations (This is known as Data Redundancy) and a loss
of data integrity as data is stored in different locations and the different
copies may be slightly different.
• Wastage of storage space: Duplication of data leads to wastage
of storage space. If the storage space is wasted it will have a direct
impact on cost. The cost will increase.
• Loss of data integrity : Data integrity means data consistency.
Duplication of data can also lead to loss of data integrity; the data are
no longer consistent.
• Data dependence: in traditional file processing, the structure of data
files is embedded in the application programs, so any changes to the
structure of a file may require changing all programs that access this file.
Therefore, data dependence means the application program depends
on the data. This means that if some modifications have to be made on
data, then the application program has to be rewritten.
• Incompatible file formats: the structure of files is embedded in the
application programs and therefore structures are dependent on the
application programming language.
The many difficulties attached to using Traditional File Processing Systems
prompted researchers to invent another way to use in order to make data
management more effective. This came up with another approach which is
DATABASE and Database Management System (DBMS)
ii) Database Management System (DBMS) approach
DBMS is a software that provides a set of primitives for defining, accessing,
and manipulating data. In DBMS approach, the same data are being shared by
different application programs. As a result, data redundancy is minimized. TheDBMS approach structure is shown in the following figure.
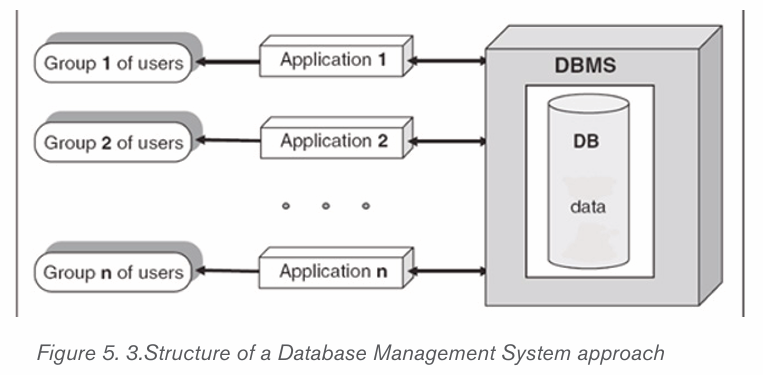
Advantages of DBMS
There are many advantages of database management system.
• Centralized Data Management : In DBMS all files are integrated into
one system thus reducing redundancies and making data management
more efficient. One user can know data in another department without
moving from one department to another. This is called data integration.
• Data Independence : Data independence means that programs are
isolated from changes in the way the data are structured and stored.
• Data consistency : In DBMS, data inconsistency is avoided. Data
inconsistency means different copies of the same data will have
different values.
For example : Consider a person working in a branch of an organization. The
details of the person will be stored both in the branch office as well as in the
main office. If that particular person changes his address, then the “change of
address” has to be maintained in the main office as well as the branch office. In
case the “change of address” is maintained in the branch office but not in the
main office, then the data about that person is inconsistent. DBMS is designed
to have data consistency which makes DBMS have the quality of increased dataintegrity.
• Data sharing : Due to the fact that data is centralized, many different
users from different locations can share data.
• Data recovery after a crash : After a break down, DBMS allows to
recover data after a crash. The crash may be caused by power failure
or hardware failure.
• Concurrent transaction control : A transaction means a collection
of operations that perform a single action in a database. Example :Transferring money from one account to another.
Concurrent transactions mean that many transactions are being done
simultaneously or concurrently.
Concurrent transaction problem occurs when multiple users want to access
data in the database at the same time like for example when someone wants
to withdraw money from his/her account while at that time there is someone
else who is using ATM card to withdraw money from the same account. DBMS
ensures that many users are accessing data and these problems are controlled.
Increased Data security and safety: DBMS allows data to be highlyprotected against unauthorized access.
Application activity 5.1
1. Differentiate paper-based database from a computerized database
and give examples
2. Outline advantages of DBMS
3. List any thre3 examples of DBMS
5.2. Key terms used in Database
Activity 5.2
By doing a research explain the term database and identify the keyterms that are used in the database field and explain them
5.2.1 Relational Database
There are different types of database but the most common type is the one that
use tables commonly known as Relational Database.
A relational database is the one having one or many Relations which are the
mathematical concept representing physically a table
In this kind of database, the table also known as an Entity may have two or many
columns also known as Attributes or Fields and details on items are stored in
rows also known as Tuples or records. A certain column has some values that
is allowed to accept and those are called Domain.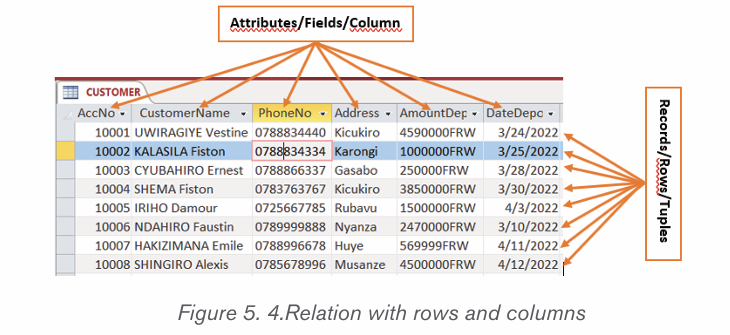
Cardinality refers to the number of rows in a table. In the above table cardinality
is 6
Degree of a relation (table) equals to the number of its attributes (columns/
properties/fields). For example, in the above table, degree is 5.
Properties of Relations in a relational database
• A table (relation) in a relational database has properties which have to be met
• The relation has a name that is distinct from all other relation names in
the database
• Each cell of the relation contains exactly one atomic (single) value
• Each attribute has a distinct name
• The values of an attribute are all from the same domain. The domain is
the type of data acceptable in a column. For example, Name column
should not accept only numbers data
• Each tuple is distinct; there are no duplicate tuples The order of
attributes and tuples has no significance
A. Primary Key
In a database table, a primary key is a column or combination of columns that
uniquely identifies table records. This column does not accept null values and all
its values are unique. The primary key column can be created by the database
manager or can be generated by the database according to the defined sequence.
A table can have only one primary key, which may consist of single or multiple
fields. When multiple fields are combined and used as a primary key, they are
called a composite key. If the primary key is already defined, it is not possible
to have two records having the same value in that field.
The figure below shows an Access table in which an AccNo column plays
the role of a primary key. The values in that column are unique, no value is like
another and no cell is empty (no null values).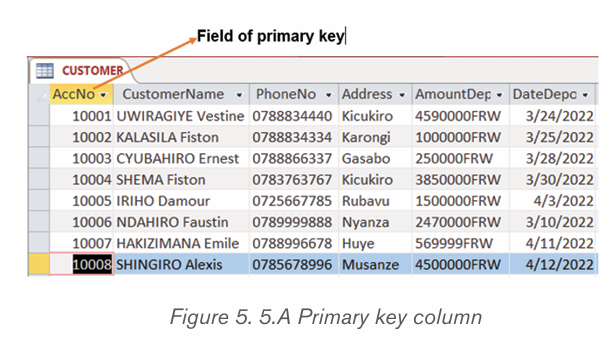
A. Foreign Key
A foreign key is a field or collection of fields in one table that refers to the
primary key in another table. The table containing the foreign key is called the
child table, and the table containing the candidate key is called the referenced
table, parent table or master table.
The image below shows a table with a unique value column whose values are
those from the master table, the AccNo is the primary key of the CUSTOMER
table while in the LOANS table the AccNo is the foreign key. All values in the
Master table don’t need to be in the child table.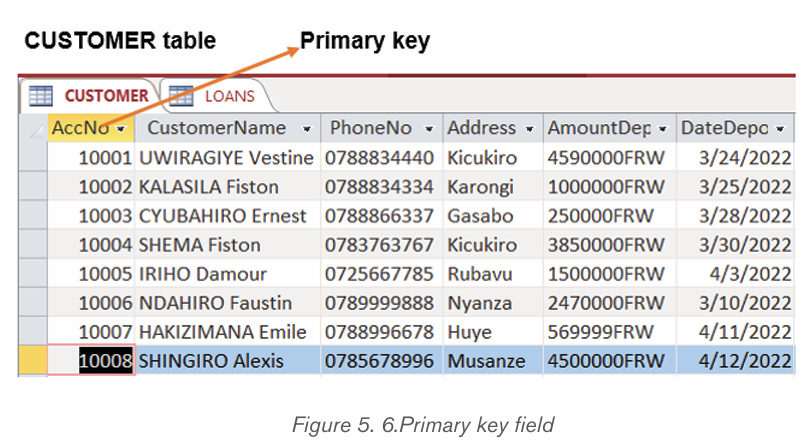
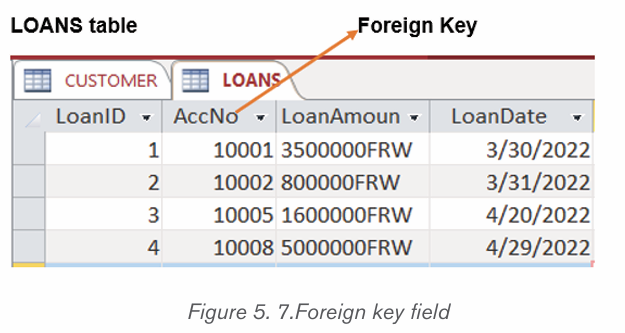
D. Candidates keys
All attributes that can uniquely identify an entity are called candidates keys. They
are never NULL and cannot allow duplication of values. When multiple possibleidentifiers exist, each of them is a candidate key.
5.2.2 Relational Database Management System (RDBMS),
RDBMS serves as an interface between the database and end users or
application programs to make sure that data is well organized and remainseasily accessible.
DBMS helps provide concurrency, security, data integrity and uniform data
administration procedures. Advanced query languages such as SQL are used
along with the DBMS package to interact with a database.
Some DBMS examples include MySQL, SQL Server, Oracle, dBASE, FoxPro,Access, etc
A. Table
Tables are database objects that contain all the data in a database. In tables,
data is logically organized in a row-and-column format similar to a spreadsheet.
Each row represents a unique record, and each column represents a field in the
record.
B. Record
A record is simply a set of data stored in a table, for example, a customer
record. A record in a database is an object that can contain one or more values.
Groups of records are then saved in a table; the table defines the data that each
record may contain.
Below is the CUSTOMER table: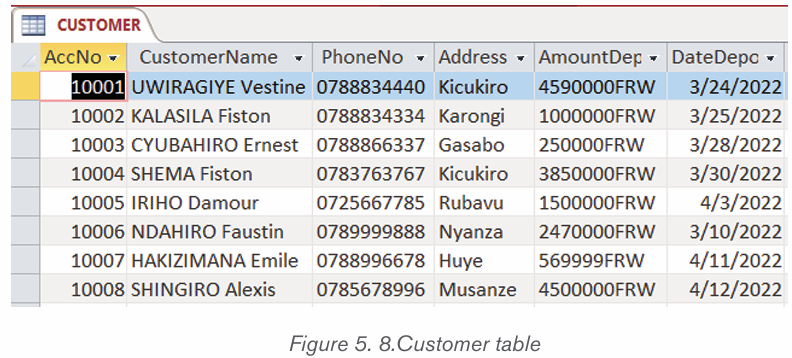
A. Field
Field is the component that provides structure for a table. A table without fields
does not exist. For instance, a database creator can create an empty table thathas fields defined but no rows (records).
A. Data type
A data type is a description of the kind of data in a table column. Each database
system recognises its own set of datatypes, although some are common to many.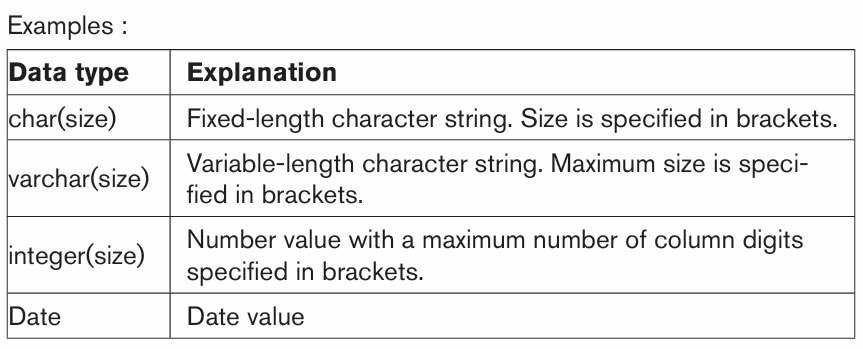
Table 5.1 Data type descriptionsBelow are different data types of table CUSTOMER in design view:
A. Relationship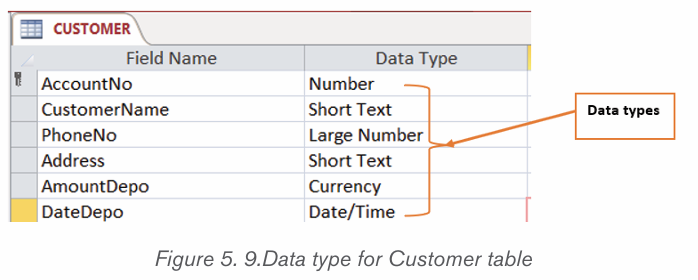
Database relationships are associations between tables that are createdusing join statements to retrieve data.
• Types of relationship
There are three types of relationships between the data that are likely to encounter
at this stage in the design : one-to-one, one-to-many, and many-to-many. To be
able to identify these relationships, it is needed to examine the data and have anunderstanding of what business rules apply to the data and tables.
a) One-to-one (1-1)
A one-to-one relationship is a link between the information in two tables,
where each record in each table only appears once.
Another example, there might be a one-to-one relationship between employees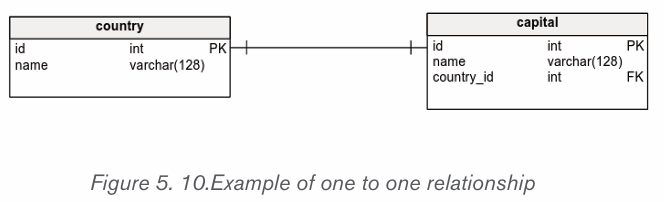
and the cars they drive, because only one driver can drive a car.
a) One-to-many (1-M)
In a relational database, a one-to-many relationship exists when one row in
table A may be linked with many rows in table B, but one row in table
B is linked to only one row in table A. It is important to note that a one
to-many relationship is not a property of the data, but rather of the relationshipitself.
Note : One customer can make many orders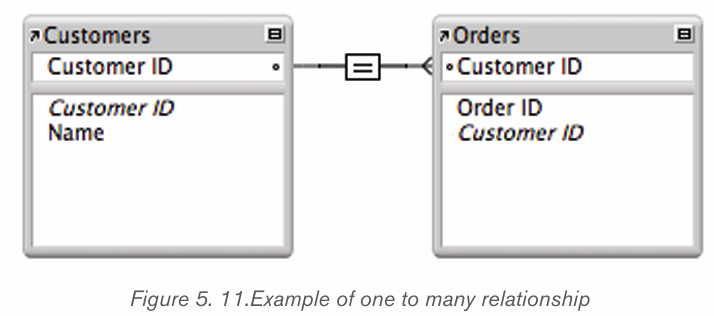
a) Many-to-many (M-M)
A many-to-many relationship refers to a relationship between tables in a
database when a parent row in one table contains several child rows in thesecond table, and vice versa.
5.2.3 Structured Query Language (SQL)
SQL is a programming language used for managing data in a relational database
SQL can be used to create a database and tables inside that database, insert
and delete data in tables, query the database and whatever other task to bedone on a database.
SQL statements look like ordinary English though the words may appear straight
or are in a shortened form. Below is a statement in Access that displays allinformation from the table CUSTOMER.
When the SQL statement above is run, it displays all the records in the table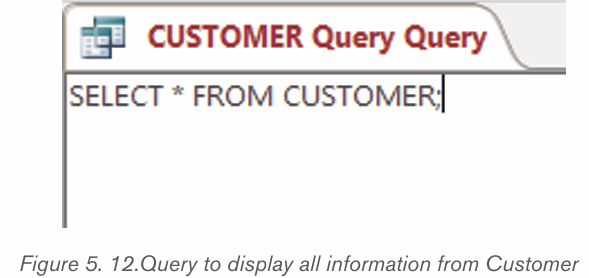
CUSTOMER.
Application activity 5.2
1. What do you understand by the relational Database
2. Explain the following terms:
a) Field
b) Table
3. Differentiate candidate key from foreign key
4.By using examples, distinguish the types' of data relationship
5.Enumerate the properties of relation in relational database6. Given the table below; identify the primary key, foreign key and records
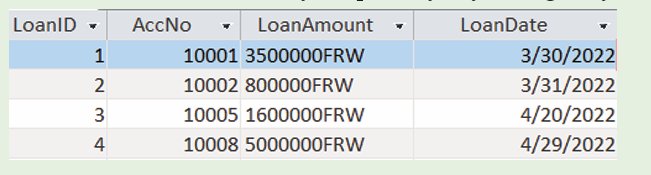
5.3. Database design process
Activity 5.3
1. Having hired as a database designer at your school,
explain different steps you will go through to design
a database that will manage your school library.
2. Discuss the benefits for your school when students,
teachers and librarian will start using the newcomputerized database of the library.
The most important thing to do to start designing a database is to plan ahead.
When a case that needs a database creation is presented, before switching on
a computer and starting creating the database it is better to think about the type
of information to work with and the types of questions that the database should
answer, what information needs to be stored and what specifically are the links
between them. The next phases are to verify all requirements specifications, torepresent the data with diagram, and to plan the database.
When data is more complex, there are more needs to plan. Even the simplest
database should be thought thoroughly on paper before being created usingDatabase Management System such as Microsoft Access, SQL, MySQL, etc.
A well-designed database performs well and adapts to future needs by giving
users access to essential information. Poor planning often results in a database
that fails to meet the current needs or the needs that may arise in the future
cannot easily be integrated in the existing database
In planning the database, regardless of its size and complexity, the following
basic steps are used :
• Gathering information (investigation)
• Identify the objects (Important Entities and their Attributes).
• Model the objects.
• Identify the types of information for each object.
• Identify the relationships between objects.
• Database optimization through normalization.
• Data entry and manipulation
5.3.1. Gathering information
Before creating a database, there is a need to understand the problem that
the database is expected to solve. If the database is to replace the traditional
method, file based approach method, then the existing system will give most of
the information needed.
In this step there is a need to work with everyone involved in the existing system
which can be a paper based database, an old database or no database at
all. Gathering techniques include collecting copies of customer information,
management reports, and any other documents that are part of the existing
system or interviewing staff who are familiar of the work done in that institution,
the staff who are expected to use the new database or who use the old one.
This step is useful in designing the database and the interfaces.
The output of this step is information on how the business of an institution is
carried out and this can be analyzed to derive the different tables (entities) that
will be needed.
5.3.2. Identifying the important entities and their attributes
During the process of gathering information, the key objects or entities that will
be managed by the database must be identified. The object can be a tangible
thing such as a person (for example student, employee, and patient), a product,
or it can be a more intangible item, such as a department in an institution, a
Combination in a school. Each distinct item in the database should have acorresponding table for which column titles are attributes of the entity.
5.3.3. Identifying the Relationship between entities
It is good to relate or associate information about various items in a database.
Identifying the relationship between entities in the design process requires
looking at the entities and determining how they are logically related and adding
relational columns (foreign key) that establish a link from one table to another.
After identifying the relationship between entities an Entity Relationship (E-R)Diagram is created using appropriate symbols.
5.3.4. Modeling the objects
As the objects in the system and their attributes are identified, they are recorded
in a way that represents the system visually. They are recorded using Relationalmodel and Entity Relational model.
5.3.5. Identifying the types of information for each object
After identifying the primary objects/entities in the database as candidates for
tables, the next step is to identify the types of information that must be storedfor each object.
These are the columns in the table of the object. Fields/columns should be kept
simple, the more atomic are the fields the more flexible will be the database.
For example, in a database of names and addresses, it is better to keep eachpart of the person’s name as a separate field.
5.3.6. Database optimization through normalization
One of the most important step to consider when designing a database
is database definition. If tables are not set up properly, it can cause a lot of
headaches at the time of extracting/retrieving required data.
Normalizing a database eliminates redundancy, and other anomalies that may
arise as the database is being used. Redundancy means that the same data issaved more than once in a database.
Those anomalies are: insertion anomalies, deletion anomalies and updation
anomalies. Normalization will be developed in details in the subsequent sections.
Update anomalies: If data items are scattered and are not linked to each
other properly, then it could lead to strange situations where one row is updated
but others are left with old values leading to inconsistency in database.
Deletion anomalies: As data may be scattered somewhere else, in a database
that is not normalized when one record is deleted, other related records mayremain in the database.
Insert anomalies: In a very long table which is not normalized, one may need
to insert some values but may not have values to insert for some columns which
may lead to tables in which some cells are filled while others are empty.
Normalization is a method to remove all these anomalies and bring the database
to a consistent state.
A Properly normalized design allows to use storage space efficiently, eliminate
redundant data, reduce or eliminate inconsistent data and ease the databasemaintenance
5.3.7. Data entry and manipulation
When the database is completely designed the last step is using it by putting
in it the data. Data can be manually entered from hard copy forms or it can be
imported from other files like excel or other files supported by the current one.
While entering data or importing it from other files make sure the data is valid
because if the database has strong validation rules, which is an ideal, it will notaccept those data.
Application activity 5.3
1. Explain clearly the role of gathering information before desing a
database2.What do you understand by database normalization?
3.With an example, differentiate update and deletion anomalies in Database optimization.
5.4. Creating, Saving, Closing and Opening a database
Activity 5.4
Create a database to manage the stock of your school kitchen:
1. Create the following three tables:
a. Foods
b. StockIn
c. StockOut
2. Identify for each table the name of the column that will have unique
values (values that don’t resemble and no duplicate values in thewhole column and that cannot contain null values)
Activity 5.4
Create a database to manage the stock of your school kitchen:
1. Create the following three tables:
a) Foods
b) StockIn
c) StockOut
2. Identify for each table the name of the column that will have unique
values (values that don’t resemble and no duplicate values in thewhole column and that cannot contain null values)
5.4.1 Database creation
A database is a collection of information. In Access, every database is stored in
a single file and has to have a name and different objects.
Different objects in an Access database are tables, queries, forms, reports,
macros, and modules.• Tables : They store information. A database can have as many tables
as are needed.
• Queries : They let database users perform actions on tables which canbe data definition queries or data manipulation queries.
• Forms : Those are attractive windows created by the database user
and provide a way to view or change information in a table
• Reports : They are summary of the information contained in different
tables which have a common characteristic.
To create an Access database first start Microsoft Office Access by clicking on
the start button then on Access 2019, in the window that will appear write thedatabase name and click on Create.
The new database is now created but has no table.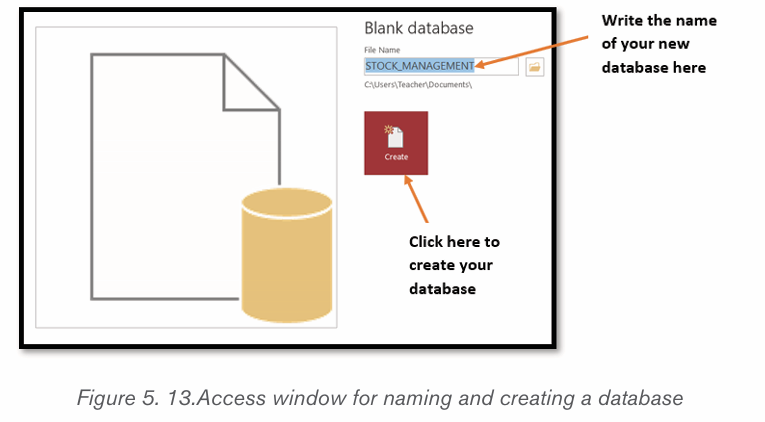
Tables can be created using one of the available options : Datasheet view, Design View
i) Creating a table in Datasheet view
When the database is created, the default option to create tables is using the
Datasheet view. The Datasheet view is the option which allows to view many
rows in a table at the same time. This option also allows to filter and sort data
using the built in sorting and filtering options. This view is also useful for quickly
viewing the details of many records, adding new records and deleting records
from a table.
To create a table in Datasheet view, do the following :
Click on Create menu then on the table icon. New table with two columns andone row appears.
• To add new columns to the existing table in the image above click on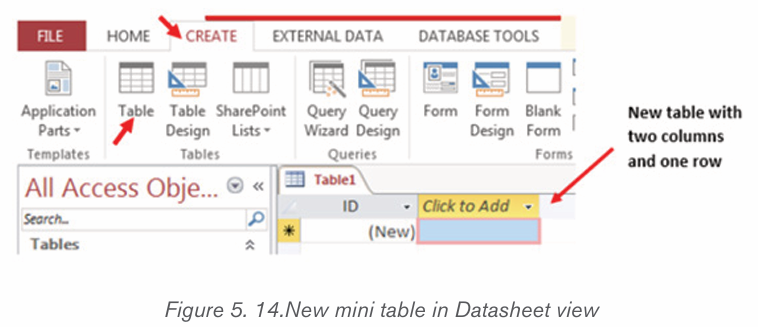
the drop down arrow next to Click to Add. In the list of data types that
will appear choose one suitable to the information to be kept in the column.
• Write the name of the new column. Repeat the same steps of choosing
the data type and renaming the column up to when you have all the
needed columns.
• Save the table by clicking on the save icon write the table name andclick on OK.
ii) Creating a table in Design view
A table can also be created in Design view and this provides additional options
compared to the Datasheet view like adding/changing the primary key and
changing the column data type. In Design view, the table structure is createdbut entering data requires using the Datasheet view
To create a table in Design view go through these steps :• On the Create tab, in the Tables group, click Table Design or in the
Views group click on the View tab then choose Design View.
• In the new window that will appear, specify the field names, Data types
and the descriptions of the fields (optional) and set the primary key by
selecting the field name then clicking on the Key icon. The primary key
column will then have a key icon in front of it
• Save the new table by clicking on the save icon and specifying thename.
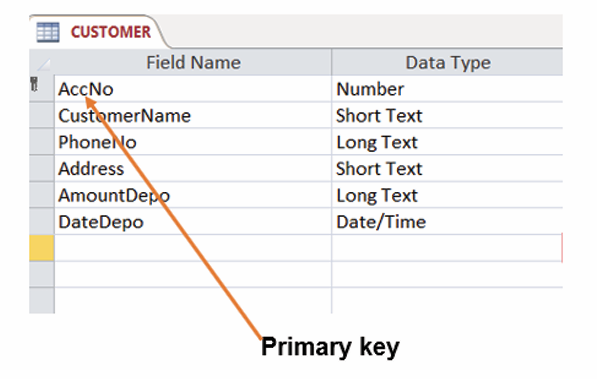
Figure 5. 15.Window to create a table in Design View
5.4.2 Opening and closing a database
A database created can be closed by clicking on the close icon of the Access
window in which it is opened. This same database can also be opened by first
opening Microsoft Office Access then going to the File tab then choosing the
Open option and browsing the database to open.
Once the database is opened, it will show its different objects (Tables,Queries, Forms, Report), choose the one you want to have access
Application activity 5.4
1. Using Access, create a database named “Payroll“ and save it on
the desktop.
2) a. Create two tables which will keep respectively Staff identification
and their Salary.b. Indicate the primary key for each table.
5.5. Creation of tables relationship
Activity 5.5
1. What do you understand by relationship in relational database?
2. With examples, explain different types of tables relationship
Table relationship is the backbone of database management as it helps in
making the many tables seem one. Without this option it would not be possible
to retrieve data from different tables at the same time but every table would be
taken as a separate entity.
For tables to be logically related they have to have a common column which
binds them; this is the foreign key.
A relationship is established between two tables when one table uses a foreign
key that references the primary key of another table. This is the basic conceptbehind the term relational database.
Here is in brief why table relationships are needed:
As most of the time a database has more than one table to work while running
queries it is necessary that tables be related as the query works by matching
the values in the primary key field of the first table with a foreign key field in the
second table.
While designing a form or a report, MS Access uses the information it gathers
from the table relationships already defined to present you with informed choices
and to prepopulate property settings with appropriate default values.
These foreign key-primary key pairings form the basis for table relationships andmulti-table queries.
A. Different relationships
There are three main relationships in database tables namely one to one, one tomany (or many to one) and many to many.
i) One to one (1:1)
In a one to one relationship one record in one table can be related to only one
other record in the other table. This kind of relationship can be implemented in a
single table and therefore does not use a foreign key which is needed only whentwo tables are to be related.
This kind of relationship is not so common as the data stored in table B could
just have easily been stored in table A. However, there are some valid reasons
for using this relationship type like security purposes, the need to diminish the
number of columns in a table and slash it into smaller tables, and various otherspecific reasons.
These are examples of One to One relationships in real life:
• In a marriage, each spouse has only one other spouse.
• A son has only one mother
• A car can be driven by one driver at a time• A President and a country
ii) One to many /many to one (1:M / M:1)
A one-to-many relationship allows a single record in table A to be related to
multiple records in table B but a record in table B can have only one matching
record in table A. This is the most common type of relationship and it is used torelate one record from the ‘primary’ table with many records in the ‘related’ table.
Examples :
Consider a business with a database that has Customers and Orders tables. A
single customer can purchase multiple orders, but a single order could not belinked to multiple customers.
• A mother can have many children
• A businessman can have many cars• One federate country can have more than one state
iii) Many to many (M:M)
Two tables have a many-to-many relationship when a single record in the first
table can be related to one or more records in the second table and a single
record in the second table can be related to one or more records in the first table.
Briefly two tables A and B are said to have a many-to-many relationship when A
record in Table A can have many matching records in Table B, and a record inTable B can have many matching records in Table A.
Examples :
The relationship between TEACHER entity and STUDENT entity is an example
of many-to-many relationship. One teacher teaches many students and one
student is taught by many teachers.• Many students are taught by many teachersCUSTOMER table• Many customers may buy many products
The CUSTOMER table will have 6 columns namely IDcustomer, Lname, Lname,
PhoneNo, Address and Gender. The data types for all the columns is Short Text.The Sex column will allow only two values: male and female.
The IDcustomer field does not need to be too long, that is why we specify its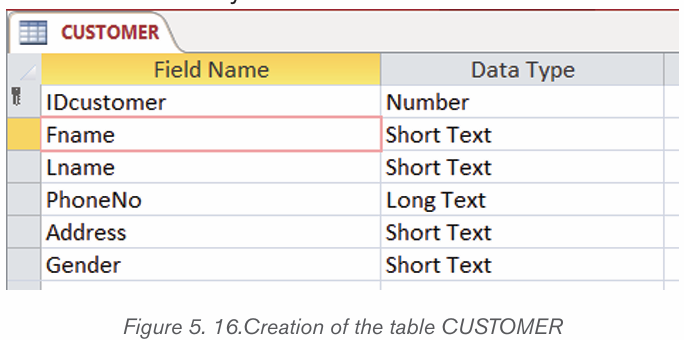
length as Long Integer. The length of a field is specified in the Field Propertiesshown in the image below which is the part of the window for fields definition.
Using this same Field Properties window, one can specify different properties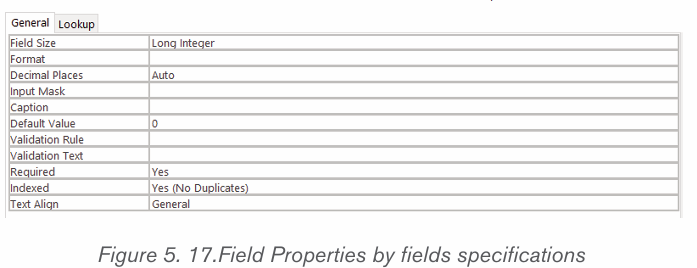
of the table fields like a customized error message when wrong data type isentered in a table and validation rules.
ACCOUNT_NO table
This table will contain information about Customers account number.
The values of Idcustomer column will be those that exist in the CUSTOMER
table Idcustomer column while those in the AccNo column are those that existin the ACCOUNT_NO table AccNo column.
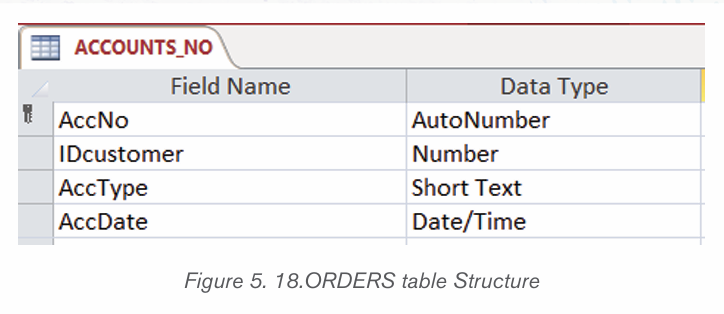
The DEPOSIT table
The DEPOSIT table has 4 rows namely IDDeposit which uniquely identify everyCustomer deposit (primary key), the AccoNo, Amount and DateDeposit.
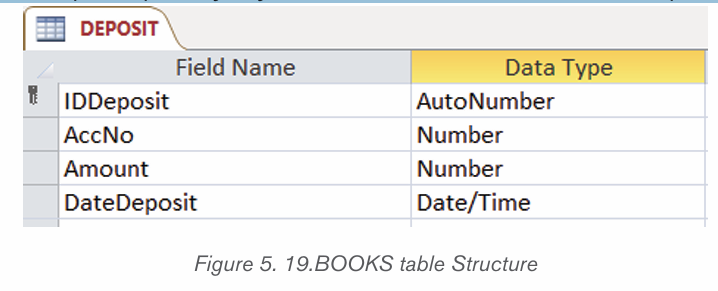
WITHDRAW table
The WITHDRAW table has 4 columns namely IDwithdraw which uniquely identifyevery Customer withdraw (primary key), the AccoNo, Amount and Datewithd.
LOANS table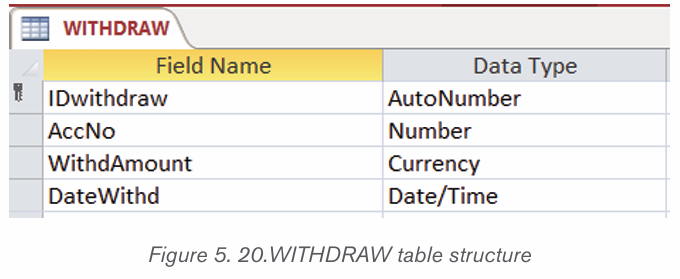
The LOANS table has 4 columns namely LoanID which uniquely identify everygiven loan to a customer (primary key), the AccoNo, LoanAmount and LoanDate.
BALANCE table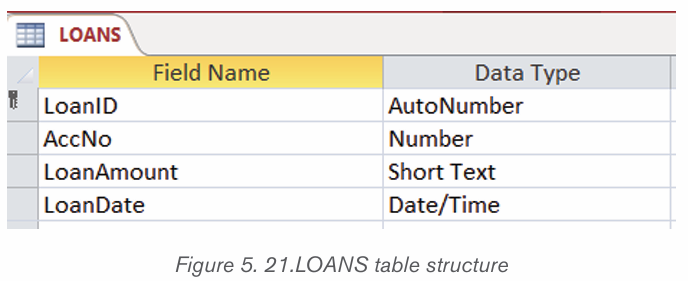
The BALANCE table has 4 columns namely IDBalance which uniquely identify
customer balance (primary key) whenever he/ or she deposits or withdrawsmoney, the IDdeposit, IDwithdraw and Balance.
B. Creating relationships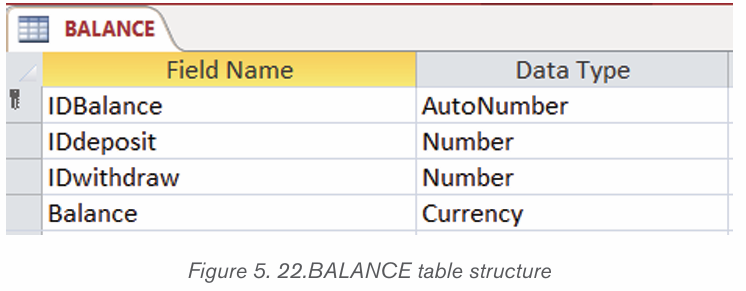
As it has been seen tables which are not normalized present many anomalies
which make such a database very bad. When database is normalized, its tables
are broken down into smaller tables which help eliminate redundancy but there
must be a mechanism to link those tables so that they can be queried as one.The mechanism used is to relate different tables by using foreign keys.
A relationship between tables is built like this :
• Under the Database Tools tab click on Relationships tool , drag and
drop the tables between which to create a relationship from the leftpane to the relationships area. Tables are dragged.
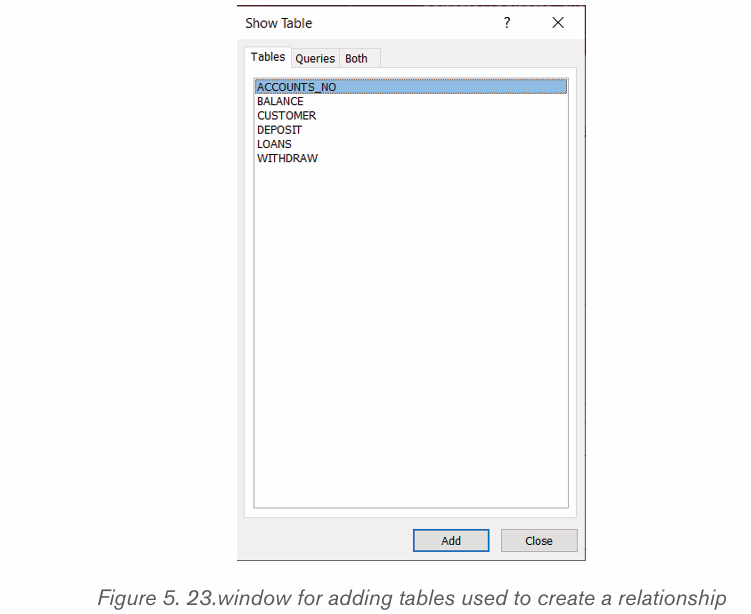
• Arrange the tables properly so as to make an easy to read diagram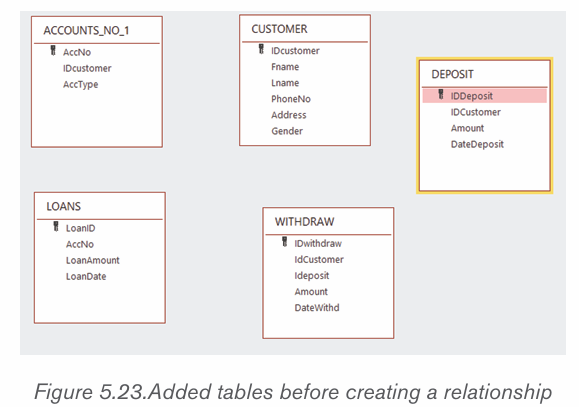
once the relationship is created.
• Click and hold down the column name from which the relationship is
to be established and move the cursor (from left to right) to the other
related column in the other table. The window below that will appearwill help in editing the relationship.
• Continue the process in the above bullets until all the tables to be linked are linked.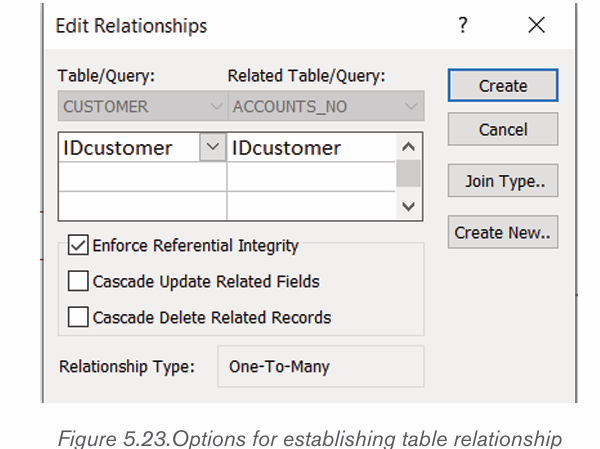
Note that the columns to link have to be of the same data type and of the same
length if not so the attempt to create a relationship will result in an error.
After linking all the tables, the relationships between the library database tableswill look like in the image below:
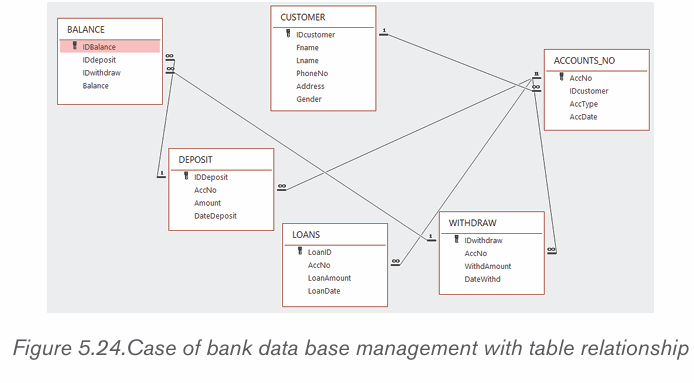
Application activity 5.5
1. Create a database with the following tables then create a relationship:
a. ITEMS (Iditem, itemname)
b. ORDER (Idorder, Iditem, quantity,dateorder)
c. STOCKIN (Idstockin, Idorder, quantity, datestockin)d. STOCKOUT (Idstockout, quantity,datestickout)
5.6. Adding Data to a database
Activity 5.6
1. Using your own words, explain what is data entry in database
2. Differentiate back-end from front-end
3. Discuss different ways that can be used to add data to an Access databaseAdding Data to a database (Data Entry)
Data entry is a direct input of data in the appropriate data fields of a database
through the use of a human data-input device such as a keyboard, mouse, or
touch screen, or through speech recognition software.
Before doing a data entry be aware of fields to enter and the validation rules
associated with those fields. This will help in avoiding to enter a wrong data type
in a field and knowing that the database will not accept that data type, it will take
time to figure out the right data to enter. Know which fields get data from other
fields (lookup), fields that have specific values (like yes/no). In short, study the
table/form before entering data.
Adding data to an Access database can be done in 3 main ways :
• Data entry through a front end interface
• Entering data in a Datasheet view table• Entering data using an Access form
5.6.1 Data entry through a front end interface
In programming and development, a front-end is a term that describes a user
interface that is used to interact with the database instead of working directly
with the database.
For example, a website front-end developer
handles the visual aspects of how the web page looks and responds to the
visitor. The front end interacts with the back end (database) which may be on
the local computer or remotely placed on a server.
The front end provides forms which are developed using different languages
like HTML (HyperText Markup Language), HTML5 and programming languages
to link the webpages to the database like PHP.
The forms provided by the front end has different fields which correspond to
the fields in the database and alert the data entry clerk whenever form validation
rules are not followed. They also provide a “submit” button on which to click for
sending data in the database.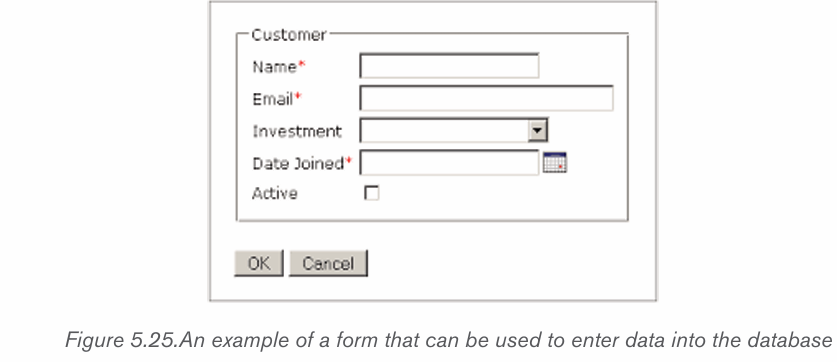
5.6.2 Entering data in a Datasheet view table
Datasheet view is one of the table viewing in Access which allows a user toenter directly data in a table.
To add records to a table in datasheet view in Access, click into this row and enter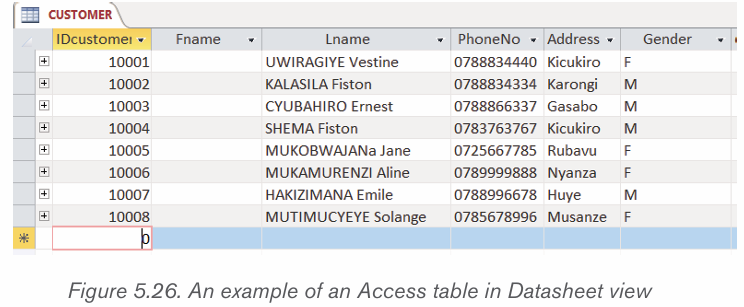
the new record. The asterisk will then change to a picture of a “pencil” as data is
being entered. The pencil will let know which record that is being edited. Another
new “New Record” row also appears once it is done with the current row.
While entering data in an Access table, it is necessary to follow the validation
rules of the table because when they are not respected, the data will not be
accepted.
5.6.3. Entering data using an Access form
Microsoft Access 2019 provides different objects the common ones being
tables, queries, forms and reports.
Access forms are accessed by clicking on the Create tab then select one of the
form options provided in the Forms group.
The Form tool is used to view table data in a form format and is accessed just
by opening the table and clicking on the Form tool
To navigate in the form’s data or to enter new data use the tools available on
Record tools group. By using the tools in this group one will be able to move to
the next row, move to the last row, empty the form so as to enter new data and
searching for a row containing specific text.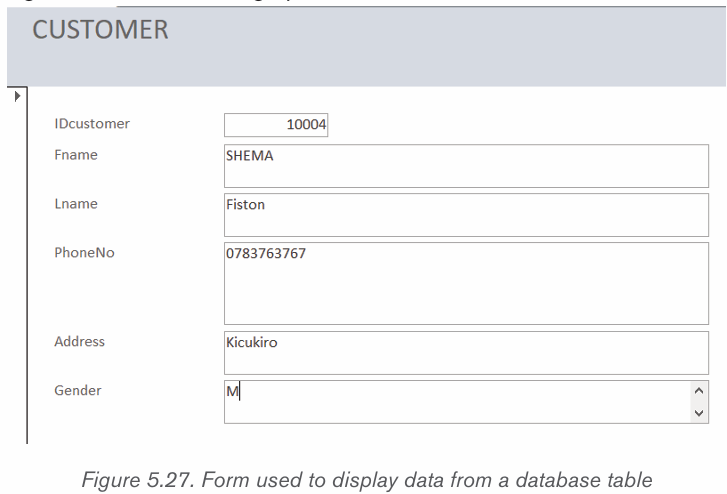
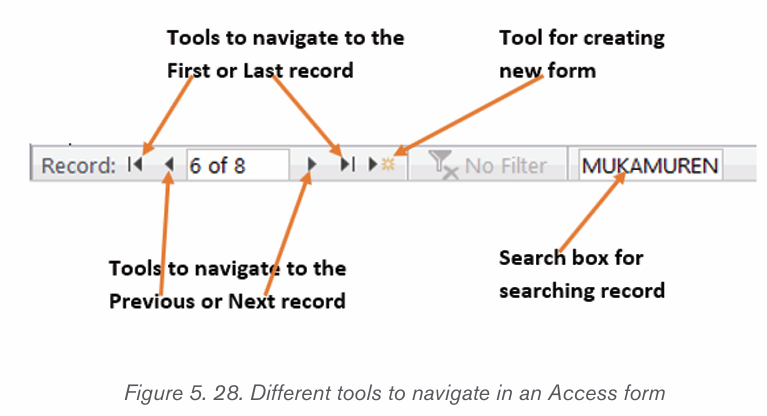
A. Designing a form from scratch
A form can also be designed from scratch and not created from an existing
table. The created form will then create a table to which it will be linked.
To create a form from scratch go through these steps :
• Under the Create tab click on the Form Design tool
• In the form area drag and drop the form design tool to use but before
this name your form by using the Title tool found in the header/footer
group. If needed also set the form’s logo.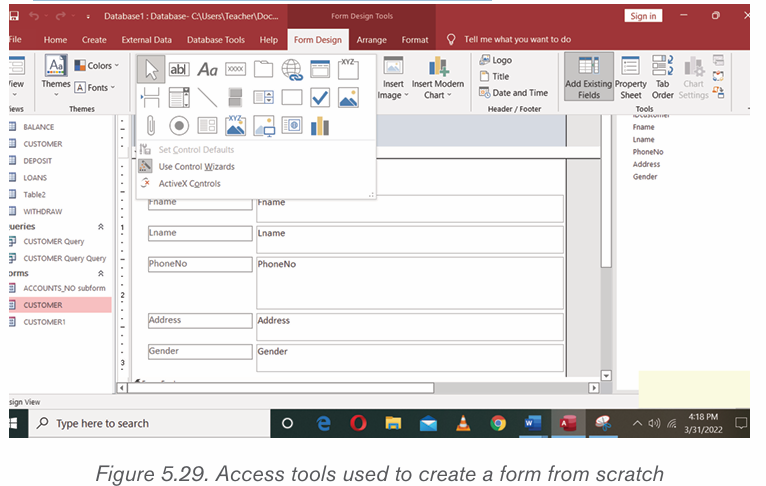
From left to right the different tools to choose from are: Select tool, Text Box,
Label, Button, Tab Control, Hyperlink, Web Browse Control, Navigation Control,
Option Group, Insert Page Break, Combo Box, Chart, Line, Toggle Button, List
Box, rectangle, Check Box, Unbound Object Frame, Attachment, Option Button,
Subform/Subreport, Bound Object Frame and Image.
B. School library form
Here is a form created from scratch which accepts data and submits it to the
database table. It has been created by taking the different tools available for
building a form. The different tools dragged from the Form Layout tool are: Logo,Title, Text Boxes, Option Group and Button.
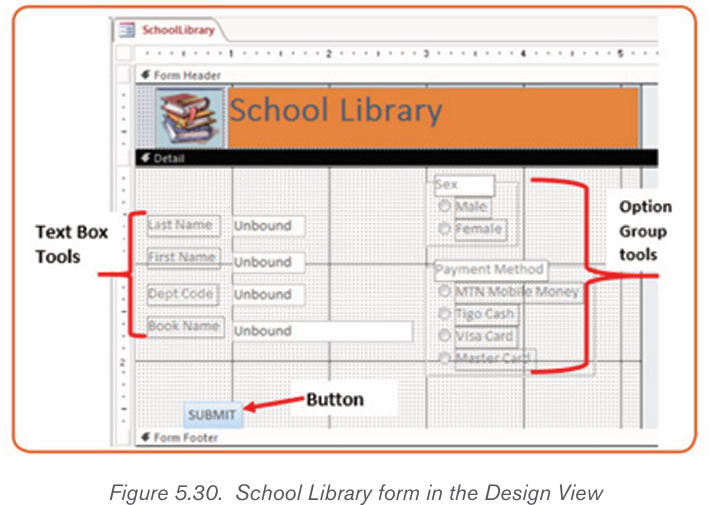
The above Form viewed in the Form view looks like this :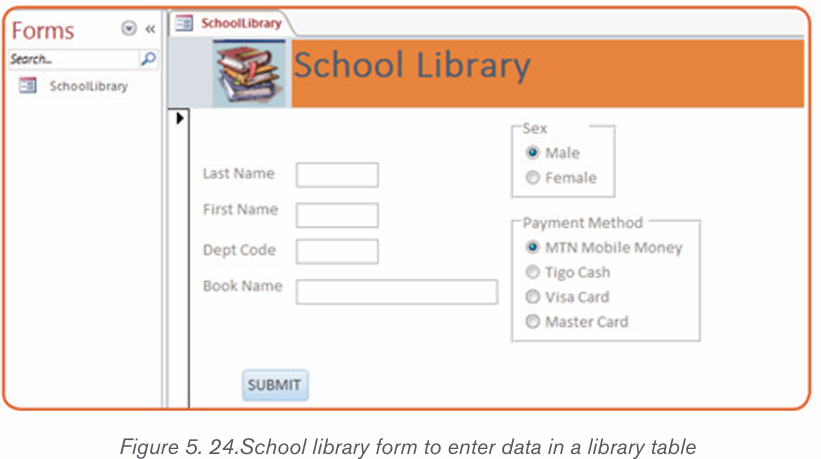
Application activity 5.6
1. Design the form below that can be used to enter student registrationinformation in the database.
a) Add your school logo.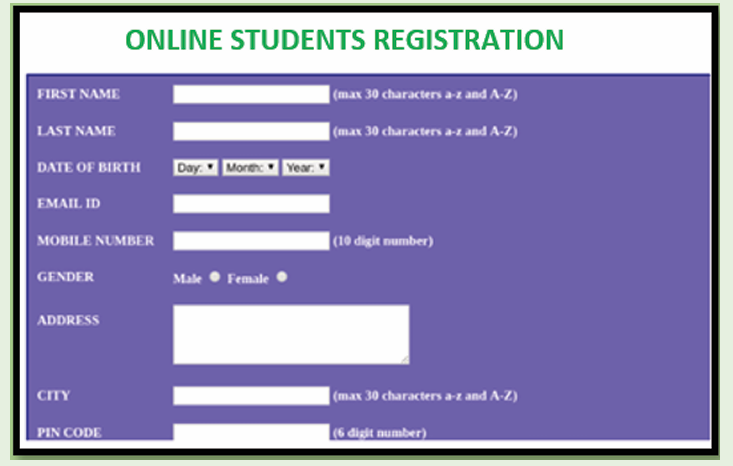
b) Make sure the table/form is validated to accept only valid data.
5.7. Querying a Database in design view
Activity 5.7
a) Create the following ACCOUNTSNO table as below: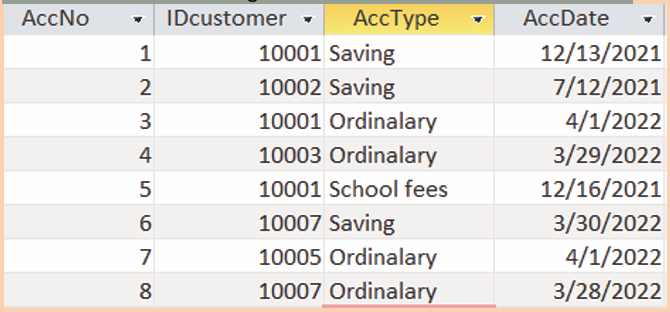
b) Display all accounts numbers which have been created in 2021.c) Display all customers accounts.
A query is a request for data results, and for action on data. A query can be used
to answer a simple question, to perform calculations, to combine data from
different tables, or even to add, change, or delete table data.
A query is a request to the database tables for data results or for action on
data. This query can help answer a question, combine data from multiple tables,
perform calculations, change or delete table data.
In Access, querying a database can be done in two ways: by writing a
query in a language that is understandable to the database that is known as
SQL query or by designing or by using the Design View approach. This section
is going to talk about querying an Access database in Design view.
5.7.1 Benefits of using queries
The benefits of using queries are so multiple :
• As the table increases in size and may have thousands of records, it is
so difficult to spot one record by scrolling through the database. The
query approach solves this problem by spotting the needed records
and performing needed actions on them
• A query can help in applying a filter on table’s data and get only what
is needed
• When one same action is to be performed on many records, it would
be a loss of time to repeat every action on every record. Doing itautomatically in a query quickens the process
5.7.2 Types of queries in Access
There are mainly two types of queries in Access:
• Select queries which are used to display data from tables or to perform
calculations
• Action queries which are used to add, change or delete data
A. Select queries
A select query is the one which displays records from one or more tables of a
database The SQL SELECT statement returns a result set of records from one
or more tables. A SELECT statement retrieves zero or more rows from one or
more database tables or database views basing on the selection criteria if there
is one.A select query on one table
To design a select query, do the following:
• Under the Create tab click on Query Design
• In the “Show Table” window that will appear choose the table on which
the query is to be run and click on Add. In this case the table BOOKS was chosen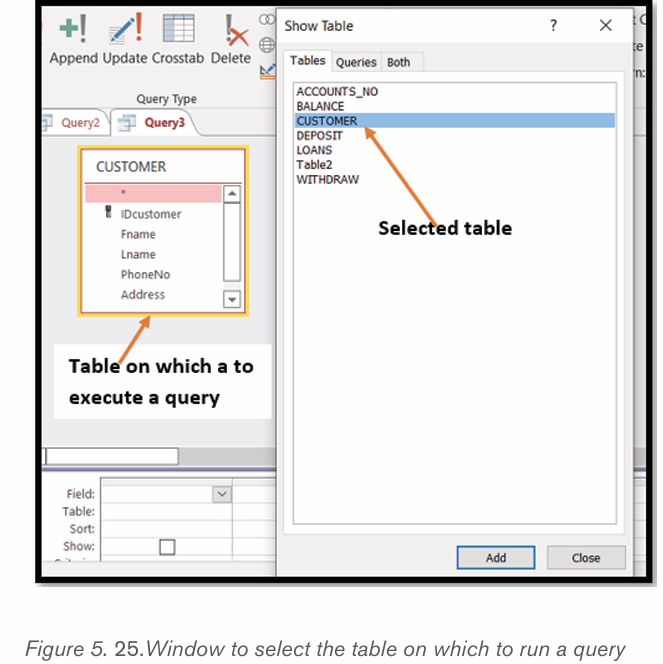
• After selecting the table click on Close to close the window
• In the table, select the columns to appear in the result. In this case onlythese columns were selected: Fname, Lname, Address, and PhoneNo.
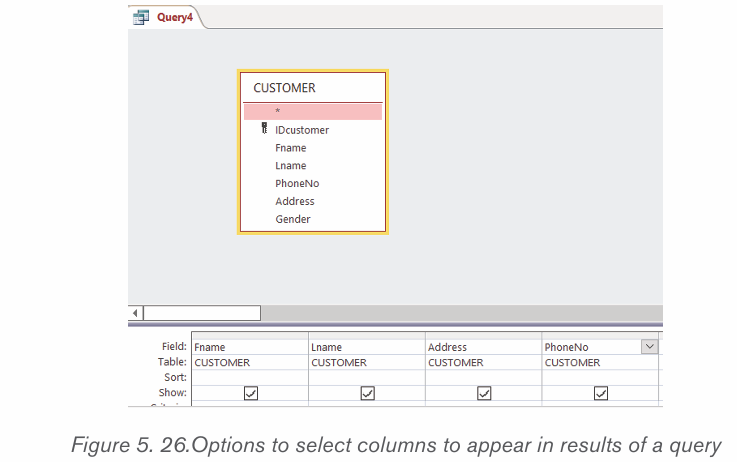
• If there is a criterion for selection specify it and if there is not one leave
the criteria field empty. In this case only books in the science category
are going to be displayed
• Click on Run to get the results of the query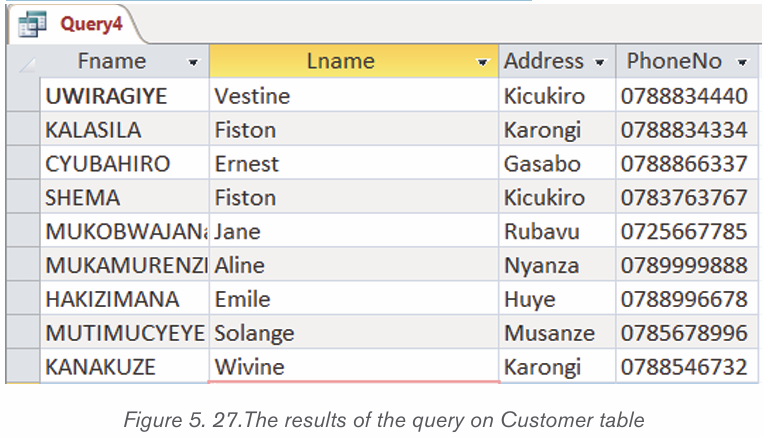
Select query on multiple tables
In a normalized database it is possible to link more than two table in order to get
a more revealing display (report). For example, in the table that have been used
one may need to know the names of students who borrowed science books and
their combinations.
To answer such a question requires to combine columns from three tables and
thanks to the foreign keys in the tables this combination is possible. The tables
to combine are: CUSTOMER, ACCOUNT_NO and DEPOSIT
To make such a query do the following :
• Under the Create tab click on Query Design
• Chose the table that are to be used in the new query. Here select all the
tables (CUSTOMER, ACCOUNT_NO and DEPOSIT)
• Select the columns that will appear in the results. Those columns are:
Fname, Lname, AccNo, Amount and DateDeposit.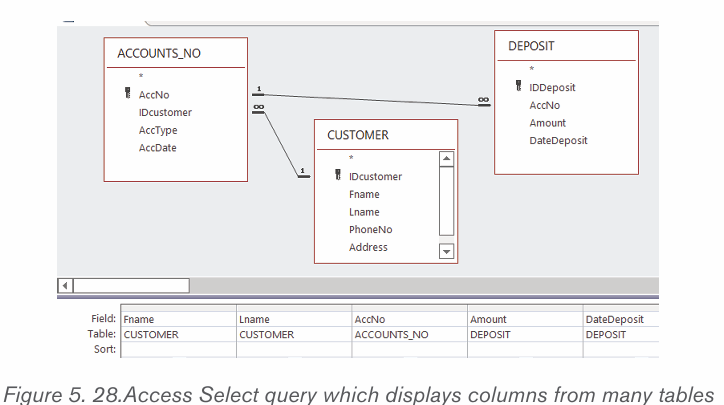
• Run the query by clicking on the Run tab which is found under the
Query Tools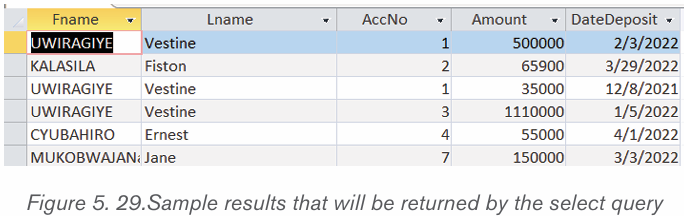
Note that this kind of query that combines many tables is possible only if tables
are related by the use of foreign key.
Application activity 5.7
Using the four tables (CUSTOMER, ACCOUNT_NO, DEPOSIT, and
LOANS) create queries in Design View that do the following:
d) Customers whose gender is Female
e) Customers whose name start with letter “M”
f) All loans that have been given to different customers in the year of 2022
End of unit assessment 5
Q1. Explain the following terms:
1. Database
2. Field
3. Table
4. Query
End of unit assessment 5
Q2. Give the difference between primary key and foreign key
Q3. Explain why it is necessary to have a normalized database
Q4. Outline the advantages of DBMS
Q5. Using the four tables (STUDENTS, BOOKS, ORDERS, and
COMBINATIONS) used through this section create queries in Design
View that do the following:
a) Students whose sex is Male
b) Students whose name start with letter “U”
c) Books which are in the Mathematics category
d)Students who study in MPC option in 2010
Q6. GIRUBUZIMA is the PHARMACY that orders, stores and sells drugs
to patients. You are requested to create the database throught doing the
following different activities:
a. Propose the name of database and create it
b. Identify and create the necessary tables(entities) and thier corres
poning fields, their primary keys and foreign keys.
c. Create a relationship between the tables
d. Create forms that will allow GIRUBUZIMA PHARMACY Pharmacist
to record all orders, to store and sell different kinds of drugs.
e. Write SQL query which displays all drugs in the stock that havebeen manufactured before end of the year 2020
Skills Lab 5
You are a business owner. Create a database that will help in the daily
management of that business. The database created should include at
least the following:
• Tables with primary keys and foreign keys
• Forms to provide interface
• Automatimatically produce reports• Has features like automatically calculating taxes, etc
UNIT 6: ONLINE BUSINESS CORRESPONDENCE
Introductory activity
Mr. Mugenzi is a businessman who buys goods from China. Those goods
consist of machineries, clothing items and foodstuff. As his business
activities are many, he is sometimes required to spend a lot of time in China
while inquiring from different sellers and completing all the formalities
necessary for his goods to be shipped to Rwanda. On average, for everyyear he spends more than 100 days in China.
1) Analyse this situation and explain how it hinders Mr. Mugenzi’s
business
2) If Mugenzi flies to China at least 50 times, estimate the price ofairfare he spends
Explain what Mugenzi would do to reduce the number of days spent inChina but get all the goods he wants
6.0. Introduction
Business correspondence is a process by which parties in a business exchange
information in a written format for the purpose of business activities. This
information exchange can take place between organizations, between customers
or between customers and organizations.
Business correspondence can be done for the purpose of inquiring from the
selling institution for necessary information needed by a customer, receiving
information from the selling institution about the goods the customer sought
information, ordering goods, sending an invoice, response on the goodsreceived.
Online business correspondence is the one which is done using online means
of communication mainly the internet. The most common online business
correspondence is through emails but selling institutions may have theircustomized channel of communication.
6.1. Emails
Activity 6.1
1) Explain how sending and receiving mails via post offices operates
2) Contrary to post offices, mails can be sent and received using computers.
a) Explain how a person can send and receive an email using a computer
b) Give at least 2 examples of emails service providers
3) You are a sales manager in one important factory in Rwanda, explainhow using emails will make your work easy.
6.1.1. Understanding email
E-Mail refers to a system of exchanging messages electronically over a computer
network between two or more email service users. These users must have e-mail
addresses which are hosted by an email service provider like Gmail, Yahoo Mail,
etc. An email service provider has a big server on which users who have emails
have dedicated space in which their email will be saved. It is like a Post Office
where every customer has a box in which all his/her mails are dropped andwithdrawn.
The email client comes in two forms, a web-based version like Gmail, where
users must log in through their browser to access their emails, or a client-based
version such as Outlook, where users install software to access emails from
their local computer. For emails to arrive at the correct destination there areprotocols which handle this task.
• Email format
The following is a sample format of an e-mail address :username@hostcomputer.domainname
Explanation :
– username: It identifies the owner of the e-mail address.
– @ (“at” sign): Separates the username from the rest of the address parts.
– hostcomputer: The name of the remote server on which the e-mail
account is hosted. For example gmail, yahoo, and hotmail among others.
– .(dot): Separates the domain name from the other part of the e-mail address.
– Domain name : It identifies the type of institution offering the services.
For example, nkeza@gmail.com, nkeza is the username, gmail is the hostcomputer and .com is the domain name for a commercial organization.
6.1.2. Creation of emails
In general to create an email the user will have to first write the email service
provider address in the browser’s address bar then fills the provided forms in
which personal information are filled. When one form is well filled, the user isallowed to move to the next step until the email is created.
a. Creating a Gmail account email
Gmail is an email service provider belonging to google. To create an email
account on gmail follow these steps :
i) Open the gmail application software using a web browser by writing gmail.
com in the browser’s address barii) In the windows that appears click on Create account
i) In the next window that appears, fill details including your names, the email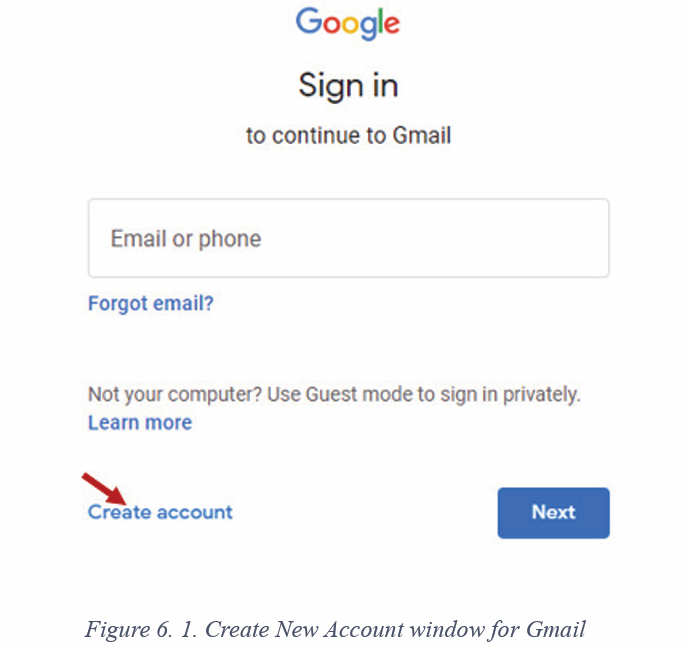
account to create and the password to be used for the new email account.
Once done with all those details click on Next
ii) Continue to the next windows in which details namely your phone number,
recovery email address, date of birth and gender will be filled. After filling
those details click on Next.
As the creation of an email is near completion, you may be required to confirmyour email by entering a google code sent to the provided phone number.
a) Rules to follow while choosing a password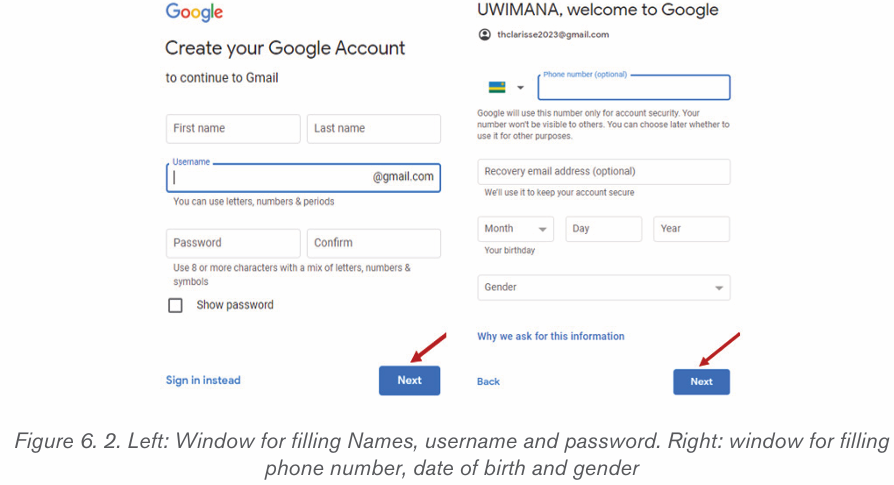
– Passwords are case sensitive.
– Always use a combination of characters that are easily to remember.
– Avoid using characters that can be guessed.
– Passwords are always encrypted for security purposes.
– Use a combination of capital and small letters, numbers and special
characters to create a strong password
– Advantages of emails
i) It allows sending of one mail to many recipients at the same time.
ii) It is cheaper compared to traditional mails which are handled by post
offices
iii) It is fast and efficient as it allows instant sending and receiving of mails from
iv) Anywhere in the world.
v) E-mails can be saved for future retrieval in another computer.
vi) It is easier to reply and forward mails.
vii) Allows sending and receiving of any form of information.
viii) Disadvantages of emails
ix) Use of email requires computer literacy.
x) E-mails are not accessible to everyone due to internet connectivity
problems.
xi) (iii) There are security concerns. Hackers are able to gain authorised
access to users’
xii) Accounts and, for example, solicit for money.xiii) Allows spread of viruses such as hoax.
Application activity 6 .1
1) Create email accounts. The email account you create should
contain your name or part of your name
2) Search the Internet for information on the effects of the emails on
global economy
3) Explain the meaning of the parts in this email address:murwanashyaka@gmail.com
1.2.Sending and receiving email
Activity 6.2
Observe the images below and answer the questions
1) What are the methods being used in images A and B to send or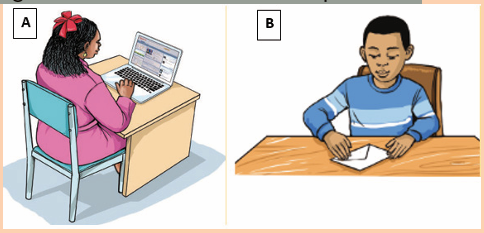
receive a mail?
2) Among the two methods which one is more efficient? Explain.3) Describe how withdrawing a mail as shown in image B is done?
Email accounts allow the sending and receiving of emails. These emails are sent
and received using a computer using a computer. For a user to receive or send anemail he/she has first to login in order to have access to the email functionalities.
1.1.1.Gmail environmentOnce the email account holder logs in, the window below will be displayed :
The gmail window environment has different tabs including Compose, Inbox,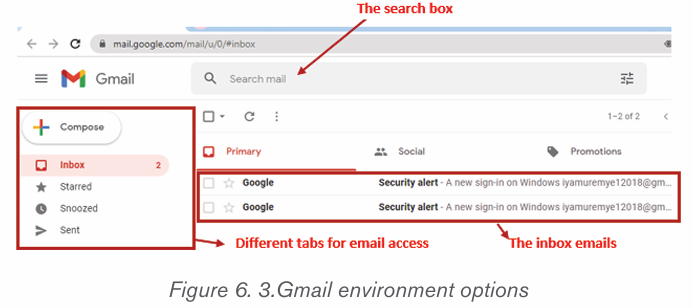
Sent, Drafts, Spam and Trash. In order to have access to the options providedby those tabs click on them. The use of each tab is summarized below :
Sending emails and attaching files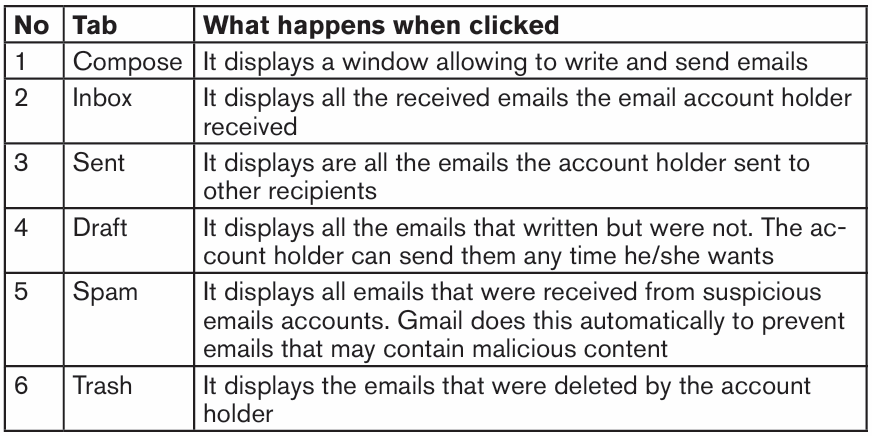
To send an email first click on Compose found in the Gmail window then follow
the following steps :
1. In the window that appeared, go in the “To” text area and write the
recipient email,
2. If there are other people who will receive copies, click in “Cc” text area
and write the email which will receive a copy
3. If there is an email to receive a blind copy Click in “Bcc” text area and
write that email. When the Blind copy option is used, the list of all the
recipients is hidden from the other recipients of the mail.
4. Write the subject of the email to be sent by clicking in the “Subject” text area
5. Write the text for the email
6. If there is a file or folder to be attached and sent with the text, click on the
Attachment icon and browse the file to be attached
7. Click on the Send buttonThe steps above described are shown in the window below :
1.1.1. Receiving emails and downloading attachment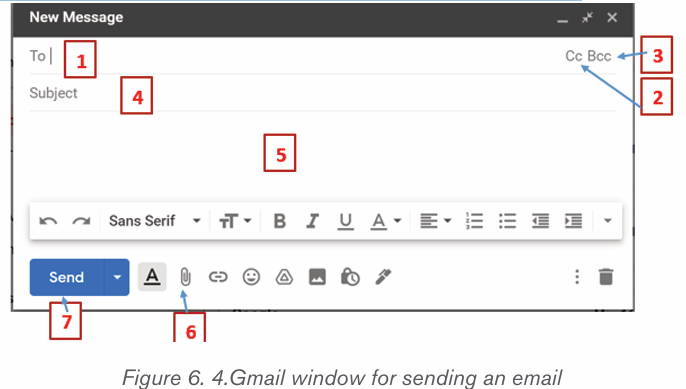
Upon signing in, the user’s inbox is automatically opened. The messages are
displayed in three columns showing the name of the sender, the subject and theDate/Time when the email was sent.
To read a message, click on the Subject. Once the message is read the user can
decide download the available attachment by just double clicking on it. In the
email received, the user can also select one of the following options available onthe message window : Reply, Reply to All, Forward and Delete among others.
– Reply : This option is selected if the user desires to respond to the
read mail.
– Reply to All : This option is selected if the user desires to respond to
all the addresses listed in the Cc, Bcc and To box. Both Cc and Bcc
forward a copy of the message to everyone listed as a recipient. The
difference between Cc or Carbon Copy and Bcc (Blind Carbon Copy)
is that, with the latter, the recipients do not get to know each other.
Note that the Reply to All option is not available when an email is
received by just one person (email)– Forward : This option is selected if the user desires to send the same
message to other e-mail addresses.
– Delete : This option is selected if the user desires to erase the mail.
Note that deleting the message only sends it to the Trash folder. The user
can retrieve the message from this folder if so desired. To permanentlydelete the message, empty the trash folder.
1.1.2. Advantages of online communication using emails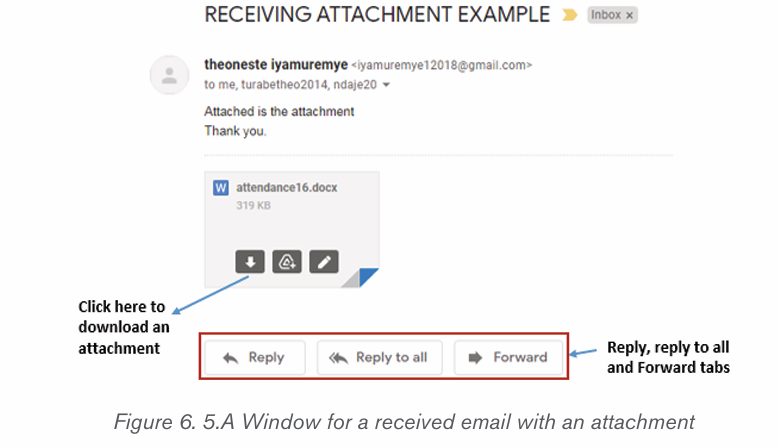
From what can be done using emails, it is obvious that online communication
using emails has many advantages. Those advantages are outlined below :
• Flexible access to participate whenever and whereverconvenient
Communication using emails can allow participants to communicate wherever
and whenever they are and the price of this communication is not dependent on
the distance and time. A person can send an email during the night, can send
an email when he/she is in a foreign country while this may not be possible for
some old communication means.
• Real time and quick response
If two parties are using the required devices, communication can be done in the
real time and the response can be immediate. This is not possible for example in
the Post Office system where a mail envelope has to pass through many carriers
until it is dropped in the recipient box.
• Cost Effective
When communication is done through emails, no cost is required for travelling
from one city to another or one country to another. All to be done is just sign upand create your account. It saves both money and time.
Application activity 6.2
1) Exchange emails with your colleagues asking them about your lessons
2) While writing an email what is the use of the tools Cc and Bcc
3) State at least 2 disadvantages that come with the use of emails.4) What are 3 advantages of email over traditional mail?
1.1.Search engines
Activity 6.3
Observe the screenshot below got as a result for the search conducted
by a Senior 4 student in Accounting who searched from the internet forinformation about Balance Sheet.
Answer the questions below: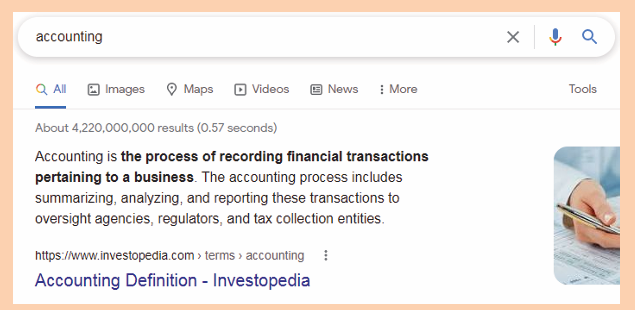
1) What is the topic entered by the student in the search box?
2) Did the student find the information about Balance Sheet that he/she
wanted? If No explain why it was not found.
3) Write in the google search box the keywords Balance Sheet.in
finance. Describe the accuracy of the information you get.
4) Now write the keywords Balance Sheet in finance inside quotation marks.
5) Compare the results found in question 3 and 4 by filling the table below:
Search Engines are programs that help the user look for and identify items
that corresponds to keywords or phrases specified from the World Wide
Web. Examples include Yahoo, Google, Bing and Ask among others which are
accessed respectively using the URLs yahoo.com, google.com, bing.com and
ask.com. As an accountant search engine are important when searching fromthe internet information related to goods and services to buy, new clients, etc.
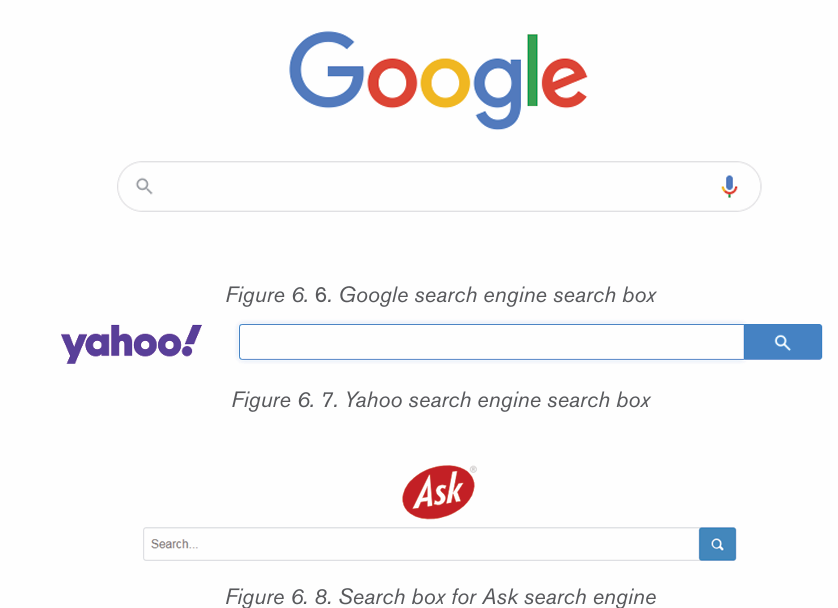
1.1.1.Strategies to find specific information using search engine
When conducting a search using a search engine one can get millions of search
results and find that none of those results is related to what should be expected.
What is need is therefore the ability to refine the search to get exactly what is
needed. Some search engines also help find less results compared to others
so change a search engine in order to get more accurate results. Below thestrategies for better search results are developed.
a) Simplify the Search Terms
Some engines include Stop words in their searches. These are frequently used
words such as prepositions (in, of, on), conjunctions (and, but) and articles (a,
the), which means that the search results have more pages of search results than
needed. It is always good to eliminate stop words from the internet searches.
However, if the search is aimed at searching for a specific title or name thatincludes them, they should then be included in the search term.
a) Use Quotation Marks
Enclosing a search term within quotation marks prompts the search engine to
search for that specific word or phrase. If the term is a single word, using quotation
marks will unnecessary variations which increase the number of search results.
For example, if searching for the word director, the researcher likely receives a
lot of results for direct, direction, directions, and so on. Typing “director” with
quotation marks, ensure that only results for that word are displayed.
If the search term is a phrase, the search will be for that specific phrase, rather
than for all the component words as individual items. For example, if searching
for the phrase director of
human resources, without quotation marks, the search returns results based
on all of the words in the phrase. Thus, surrounding the term with quotationmarks, will generate results that feature this specific phrase.
a) Remove unhelpful words
The use of a hyphen, small dash or minus sign immediately before a word
excludes it from a search. For example, typing in marketing -digital will exclude
digital from the search engine, making it easier to find the information searched
for. Typing marketing -digital -social would allow researcher to get rid of bothmarketing and social terms.
b) Refine the search using operators
Other characters, known as operators allow to narrow down the internet
search in more precise ways. A few of those are explored here below:
• Wildcard searches: Use wild card character to represent any other
word to search for. In this case use the * symbol to represent any other
word. For example, searching for *man in the world returns results for
the richest man in the world, the tallest man in the world, the oldest man
in the world, and so on. Wildcard searches are also useful for examplewhen researcher do not know the full text to search for.
• Combination searches: This is a technic by which the searcher
combines search terms using boolean operators AND, OR, NOT,
NEAR. These operators enable user to search for two or more terms
simultaneously and is most useful when those terms are very similar.
For example, typing selling OR retailing, will return pages where either
of the terms is used, without both needing
to be present. The AND operator ensures that the searcher receives only search
results that include two or more terms. Apart from these operators one can alsouse NEAR
• Search in a specific Site: Typing the URL of the website that the
searcher wishes to search and a search term limit the search to a
single website. For example, typing in the search box: reb.rw” Director
General” will return all the pages from reb.rw that contain the term
“Director General”
• Advanced search techniques using tilde sign (~)
When the tilde operator is placed in front of a keyword, it also searches for
words that are synonyms of that keyword. The searcher can use the tilde
operator (~) to get Google or other search engines to expand the search with
related keywords. This is helpful when one does not know the entire searchquery to use.
Application activity 6.3
Using the different search technics you have learned, search for the
following by making sure that you get more accurate results:
1) How taxes are collected in East Africa2) Causes of economic crises
6.4. Online sales and purchase process
Activity 6.4
Mushoramari wants to start a new business in which he will be selling car
spare parts to clients around the country. He wants to use emails in most
communications to replace physically meeting his clients so as to reduce
some costs to clients.
Explain how the sale and purchase process will be conducted in regard tothese concepts: inquiry, quotation.
Online sale is the use of internet and other electronic means to sell goods and
services to clients who are not physically present at the selling agent. For these sales
to be possible sellers use web sites, search engines, social media, e-mail and other
electronic means to request or provide information from sellers.
Online sale goes together with online purchase. Online purchase allows consumers to directly buygoods or services from a seller using the same channel as in online sale.
Online sales and purchase goes in a certain process in order to ensure that
when the seller and buyer conclude their deal both are satisfied. An online sale
and purchace using email can be conducted by following the process outlines
below:
A) Inquiry
Exercice 1: Role play
Inquiry is a process by which a person asks and gets information from someone
having more knowledge therefore resolving doubt. While doing an online
purchase inquiry can be conducted from the seller in order to know the kind of
products sold. In this phase, the buyer who may have a big idea of the product
to buy will ask for additional information like the product specification, price,
possibilities of a discount, packaging options, delivery methods and duration,
etc. After the buyer and the seller have agreed on the product, the seller sendsquotation to the buyer.
You are an investor specialized in hospitality specifically hotels and you want to
buy plates for one of your hotels in Rwanda. Write to an industrialist involved
in manufacturing asking him/her about plates you want to buy. Use your Gmailaccount to do this.
A) Quotation
A quotation is a document that a seller provides to a buyer to offer goods or
services at a stated price, under specified conditions. Quotations are used to let
a potential buyer know how much goods or services will cost before they decide
to buy. A quotation should include among other the price, an expiration date,your company details and your customer’s details.
A quotation also represents the brand identity and professionalism. If it looks
not attractive and not well-structured, the potential buyers will assume that the
business is not well run while if this quotation is well presented this can be asign of attention to details and the value of service provided.
Qualities of a good quotation
For a quotation to be an incentive for buying, it should meet the following :
– Visual content : Images convey easily a message than words. It is
therefore good to make the service more visual by including reference
images, videos and graphs that best reflect the process and the results.
Visuals will help to paint a clearer picture of what will be working on
and enable to demonstrate all unique features of product/service in a
clear fashion.
– Design and format : It is good to have quotations which are in an
attractive design. To be attractive, these quotations should also haveappropriate and attractive colors.
Exercise 2: Role play
1. You are the hotelier in Exercise 1 and you have got satisfying information
from the industrialist manufacturer. Now write to him/her requesting for aquotation for the plates you want to buy.
2. You are the industrialist manufacturer. Send to the hotelier the requestedquotation using your Gmail account.
3. You are an investor specialized in hospitality specifically hotels and
you want to buy plates for one of your hotels in Rwanda. Write to an
industrialist involved in manufacturing asking him/her about plates youwant to buy. Use your Gmail account to do this.
A) Order
Writing an order for goods and service is done when the customer has been
satisfied with the information provided in the quotation. An order should amongothers include a list of items required with the quantities.
Exercise 3: Role play
a) You are the hotelier (in Exercise 1 and 2). Write an order of the plates
you want to buy.
b) You are the Industrialist, respond to the customer from which you have
received the order.
a) Invoice
An invoice is a commercial document issued by the seller to the client about a
sell transaction. This document shows the products, quantities and the price
that were agreed on between the seller and the buyer.
Exercise 4: Role play
1) You are the industrialist manufacturer who received an order (in Exercise
3). Write an invoice to your customer.
A) Goods delivery note
A goods delivery note accompanies the goods sent to the buyer. It shows a list
of the products and the quantity of the goods included in the delivery.
Exercise 5: Role play
You are the industrialist who sent the goods that were ordered by the hotelier.
Now send the goods delivery note to the customer.
Application activity 6.4
Divide in two groups and play the role of buyer and seller then:
1) Imagine you are an owner of a company that sell planes
2) As customer and buyer interact so as to show all the process
involving inquiry, quotation, order, invoice, Goods delivery note
You may use internet to get information to help you do this role play.
6.5. E-commerce
Activity 1.1
Kamikazi wants to buy a Management Accounting book. She visited many
libraries in the country but she could not find the title she wanted. She
decided to search for the book using google.com but she could not also
find it. Finally, she realized that the book is available online on amazon.com
and the price is at 15$. She therefore decided to buy it from amazon.comwhich is located in US.
1) What is the common name for that selling and buying business done online?
2) Discuss the process Kamikazi will go through in order to buy that
book and have it delivered to her
3) Brainstorm the other local and global e-commerce platforms that can beused to buy goods and services online
6.5.1. Introduction to E-commerce
E-Commerce or Electronic Commerce also known as e-Business, is the buying
and selling of goods, products, or services over the internet using electronicmeans of payment like credit cards.
The history of e-commerce dates back to the invention of the very old notion
of “sell and buy”, electricity, cables, computers, modems, and the Internet.
E-commerce became possible in 1991 when the Internet was opened forcommercial use.
At first, the term e-commerce meant the process of execution of commercial
transactions electronically which gives an opportunity for users to exchange
business information and do electronic transactions. The ability to use these
technologies appeared in the late 1970s and allowed business companies andorganizations to send commercial documentation electronically.
6.5.2. E-commerce models
Electronic commerce can be classified into four main categories. The basis for
this simple classification is the parties that are involved in the transactions. Thefour basic electronic commerce models are:
a) Business to Business
In a business to business model companies are doing business with each other.
The final consumer is not involved. So, the Online transactions only involve themanufacturers, wholesalers and retailers, etc.
b) Business to Consumer
Here the company will sell their goods and/or services directly to the consumer.
The consumer can browse their websites and look at products, pictures, read
reviews. Then, they place their order and the company ships the goods directly to them.
c) Consumer to Consumer
Consumers are in direct contact with each other. No company is involved. It
helps people sell their personal goods and assets directly to an interested person.
d) Consumer to BusinessThe consumer provides goods or services to the company.
6.5.3. Online shopping malls
Around the world and in Rwanda there are different companies which sell goods
online. Some of them are Alibaba, Amazon, Kikuuu, Vuba Vuba. For every online
shopping mall buying goods is done in this way:
– The client creates an account on the online shopping mall. This account
will allow the client to be uniquely identified in the mall’s online system.
In order to create an account, open a web browser and enter the
address of the mall in the address bar of that browser and follow the
directives found on that platform,
– The client with an account uses his/her account credentials to login in
the system. The credentials most of the time consist of user name and
password,
– Now that the client has logged in the system, she/he chooses the
goods to buy. In the mall’s system, goods are shown with their names,
images and prices. The price to pay add up as the client selects more
goods to buy.
– The client chooses the payment methods like MTN Mobile Money, Tigo
Cash. There are also other payment methods which can be used like
credit/debit cards, bank transfers, etc
a) Local online shopping malls
Kikuu is one of the e-commerce platforms available in Rwanda with which one
can buy available goods and have them delivered to his/her preferred location
in Kigali. When a client wants to buy from Kikuu he/she visit the platform kikuu.com or rw.kikuu.com whose screen is displayed below:
Vuba vuba is an online shopping mall which is specialized in the selling of food,
supermarket goods and party groceries delivery service with Vuba vuba. This
platform is accessed through the link vubavuba.rw. However this platform is
used on telephone and their corresponding apps are downloadable throughGoogle Play or App Store.
a) Other online shopping malls
Application activity 6.5
1) What is e-commerce
2) With an example explain business to consumer e-commerce model
3) State e-payment methods that are used when buying goods and
services online.
4) Discuss the major benefits of E-commerce over traditional commerce?
6.6. E-procurement, E-tax and E-payment
Activity 6.6
Do a research and explain how procurement, tax collection and fee payment
were done in Rwanda in the years 1980.
1) What were the disadvantages of that system?
2) Briefly explain how procurement, collection of taxes and fee paymentis done nowadays.
6.6.1. E-procurement
• Definition
E-procurement is the buying and selling of goods and services using internet
through dedicated web applications. E procurement is designed to centralize
and automate interactions between organizations, customers and other parties
in the procurement so as to increase the speed and efficiency of this process
(procurement).
• The benefits of e procurement include :
– Automation of tasks which otherwise would be laborious. Those tasks
are like document management for purchase orders, evaluating and
selecting suppliers, storing supplier contracts, etc
– The procuring process becomes less centralized meaning that both the
client and the procuring entity can view the status of the procurement
anywhere and anytime
– Reduces the risk of corruption and document loss as every action done
in the procurement system is recorded. It is not possible for example to
remove a submitted file and pretend that it was not submitted but this
can be done in a paperbased procurement.
• Procurement web application in Rwanda
As many sectors are being computerized, procurement was not left behind. That
is why there is in place a system umucyo.gov.rw which is used in procurement
in order to make it quick and easy. The features of this system can be accessed
when the user is not logged but personified features are accessed when the
user is logged. When not logged one can have access to the list of procurementplan both in the current financial year and the old financial years.
6.6.2. E-tax
In Rwanda, taxes are collected by Rwanda Revenue Authority while there are
also taxes collected at the local level. These taxes are collected using the RRA
website which is linked to an application to allow tax declaration. There is also a
Rwanda Trade Portal (rwandatrade.rw/) which is used to calculate import duties
and taxes. This application is connected to the Rwanda custom database whichmakes it calculate accurately the taxes to be paid.
6.6.3. E- payment--
E-payment is a way of carrying out transactions or paying for goods and
services using an electronic medium without using the traditional way of
payment involving cash or check. This payment can be between people,
between people and institutions, between institutions.
Inside the country the e-payment between people can be done using
MTN Mobile Money, Airtel Money or Tigo Cash. The e-payment from
institutions to people can be done using different application which
allows a depositing of money from the institution account to the people’s
accounts. For example the payment of salaries to public servants is doneusing MINECOFIN system.
• Exercise:
Do a research on how public institutions pay their staff using e-payment means.
Your findings should include: the name of the system, the process of paymentand how to prevent fraud in the payments.
• Characteristics of an e-payment system
As E-payments systems are used for managing the payment of money, no error
is allowed. The main characteristics of an epayment system in order to prevent
errors to the maximum are the following :
– Security: Because e-payment systems involve actual money, it is more
likely that criminals will attack these systems. Therefore these system
must be protected against any cyber attack.
– Reliability: As more services adopt e-payment, all the life in a
country will depend on the e-payment systems. Therefore any problem
encountered by that system will greatly impact the whole country. This
explains why e-payment systems should be always available and should
not fail.
– Scalability: The internet is growing rapidly and people migrating from
the old way of payment to e-payment increase rapidly. An e-paymentsystem must be able to accommodate an increase in number of people
using it and must not crash, be unavailable or lose its performance
because the number of transactions has increased. Therefore an
e-payment system must support the addition of infrastructure withoutstopping the service.
– Anonymity : There are transactions for which the identity of the parties
to the transaction should be protected. An e-payment system shouldtherefore allow this anonymity when it is needed.
Application activity 6.6
Visit the web applications that are used for procurement, tax calculation,
e-payment.
3) What is the feature found in the e-procurement application?
4) Describe what you can do when using the e-tax application. What are
its advantages compared to when there was not a web application to do it?
5) Do a research and enumerate services in Rwanda which are paid
using e-payment systems. For each service show the system used.
End of unit assessment 6
1. Give examples of services that can be paid electronically in Rwanda
2. Differentiate credit card and debit card?
3. Discuss techniques you would use to get accurate search results
when searching using a search engine
4. Discuss the advantages of using emails in carrying out communication
Differentiate Cc and BCc as two options which are provided while
writing emails.6. Explain the different e-commerce models
UNIT 7: INTRODUCTION TO WEB DESIGNING
Introductory activity
1. Analyses the following statement and decide which is true by
“T” and not true by “F”
a) Today’s world, it is the rare person who has not had some
exposure to the Internet and the World-Wide Web.
b) If you are buying a computer, make sure that it can be
connected to a wireless network.
c) you will need to pay to get a connection in your house
which will allow you to access the internet.
d) once you have an internet connection then you’ll need to
have an internet browser on your computer. This browser
allows you to browse websites.
1. Do you know a web site? the answer is yes, continue on next
questions if is no skep the next questions about website
2. State three names of websites you know
3. Can you change or delete an information from a website?
Explain your answer.
4.Discuss on advantages and disadvantages of a website5. What is a home page on web site?
Activity 7.1
What do you understand by the terms below?
i) Internet
ii) Network
iii) WWW
iv) Web application
v) Browser
vi) Web servervii) Static web page and Dynamic web page
1.1.1.Understanding web design
Today’s world, it is the rare person who has not had some exposure to the
Internet and the World-Wide Web. Many people have not only used the Internet
but have also created web content in some form or other. Individual is using
websites to communicate company information and manage their projects.
People are now reconnecting with their friends and family members on social
media such as Facebook, Twitter, Instagram, YouTube etc.
The purpose of this Unit, is to provide you with a brief introduction to web and
how to access and use it via a web browser and other basic concepts relating
to web designing such as website, web page, web application, static web pageand dynamic web page.
7.1.2.Key terms
Web design is a process of designing and developing websites. Unlike web
development, which is mainly about functionality, web design includes aesthetics
and is concerned about the look-and-feel of the site as much as the functionality.
The creative aspect of web design covers areas like web graphic design, user
experience design, interface design. Web designers work with tools like Sketch,
Figma, and Photoshop. The technical aspect covers front-end and back-enddevelopment with tools and languages like HTML, CSS,etc.
The Internet is a collection of computers around the world connected
to each other via a high-speed series of networks. The computers that
store the files are called servers because they can serve requests from
many users at the same time. Users access these HTML files and documents via applications called browsers
A Web browser is a program that displays Web pages and other do
cuments on the Web. Unfortunately, different browsers may interpret
the HTML of Web. There are a variety of browsers available but themost popular are:
• Internet Explorer (from Microsoft)
• Firefox (from Mozilla)
• Safari (from Apple)
• Chrome (from Google• Microsoft Edge (From Microsoft)
Web page: Each single resource on the web is called a web page. A
web page is a document commonly written in HTML (Hypertext Markup
Language), is also called hypertext document containing more specific
information such as text, images, sound, video and so on; that is accessible
through the internet or other networks using an internet browser.
A website is a collection of several web pages with information on a
subject that are connected together. Websites can be easily searched
using search engines like Google. The World Wide Web is madeof many websites and each is made of many webpages.
A web application is a computer program that utilizes web browsers
and web technology to perform tasks over the Internet is stored on aremote server/web server.
The main difference between a web application and a website is given below:
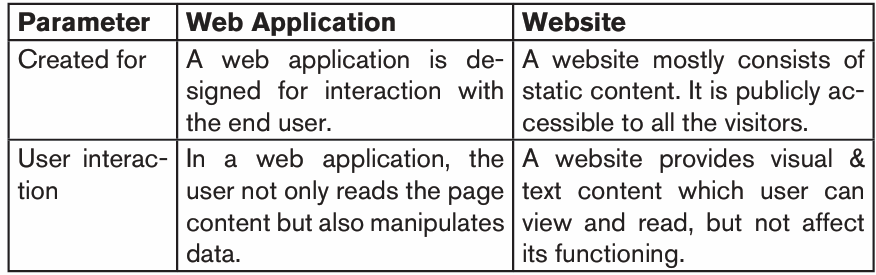
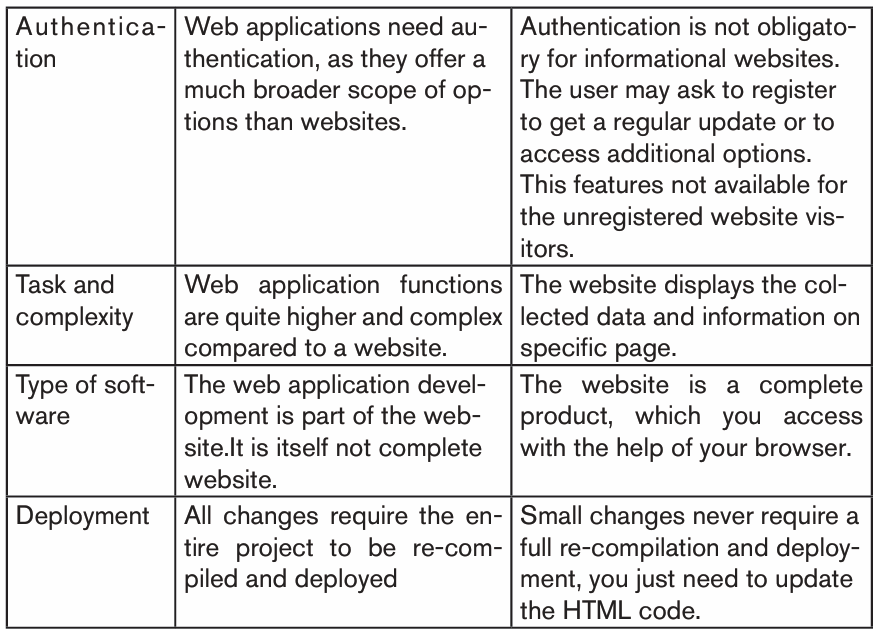
Web server: Is a computer that hosts a website on the Internet.
Search engine: Is A web service that helps you find other web pages,such as Google, Bing, Yahoo, or DuckDuckGo.
World Wide Web: The term World Wide Web (WWW), usually
shortened to the “web” is a system of interlinked hypertext documentsaccessed through the Internet.
Really the Internet is the system that facilitates the transfer of data and the web
is the data itself. The web is just one of the ways that data can be circulated
over the Internet.
A dynamic web page website is one whose displays different types
of content every time a user views it. This display changes depending
on a number of factors like viewer demographics, time of day, location,language settings, and so on.
A static webpage is one whose contents do not change, or at least do not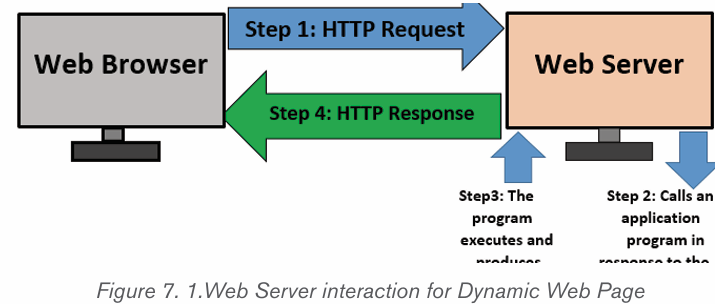
change quickly. A static page is one that is usually written in plain HTML
and what is in the code of the page is what is displayed to the user. These
are webpages that contain information that does not need to be updated.
They are always the same unless the content is changed physically on the
server’s hard disk. That is the reason these web pages are known as staticweb pages.
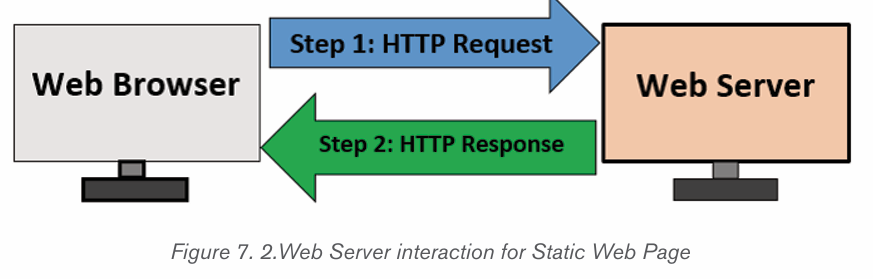
Application activity 7.1
1. Discuss different characteristics of a website and a web application?
2. Define a web application and give two examples of web applications?
3. Among web application and web site, what is the advantageous?
Explain your answer.
4. With a comparison table, differentiate static web page to dynamic web page
5. Discuss reason why it is easier to update a dynamic web site
compared to a static website.
6. Is it very cheap to host static website in comparison with dynamicwebsite? Explain.
1.1. Introduction to HTML
Activity 7.2
Using internet or other available resources, find the answers to the following
questions:
1. Write in full the abbreviated terms bellows:
2. WWW, HTML
3.Explain what is www
5.Discuss the importance of HTML
6. Discuss and write an essay on how Hypertext Markup Language (HTML)had evolved from 1991 to the current trends seen today.
1.1.1.Definition of HTML
HTML is the Standard Markup Language. It is the authoring language that
describes how a Web page should be displayed by a Web browser. It is used
for developing Web Pages. Hypertext means when a visitor clicks a link on aWeb page, the visitor is led to another Web page or document.
«Hypertext» refers to links that connect web pages to one another, either within a
single website or between websites. Links are a fundamental aspect of the Web.
HTML uses «markup» to annotate text, images, and other content for display
in a Web browser. HTML markup includes special «elements/tags» such as
«heading», «paragraph», «table», and so on. This unit discusses various HTMLtags that are needed for developing web pages.
Note: HTML is not a programming language, it is used to describe what
should appear in a web document/page. HTML is not run/executed,
it is parsed and transformed into Document Object Model (DOM)
objects by the client web browser, which the browser can then render.
Something like C++ is first put through a compiler then executed onthe machine.
1.1.1.Evolution of HTML
The HTML was invented by Tim-Berners Lee, the founder of World Wide Web.
Lee’s original HTML version was based on a more complicated document
processing language known as Standard Generalized Markup Language
(SGML). Soon, Lee released different versions of HTML causing incompatibilities
between different developers using different versions. For this reason, thefollowing was done:
• A consortium known as World Wide Web Consortium (W3C) was
established to standardize HTML.
• The first standard version of HTML that was developed and maintained
by W3C was HTML 2.0 released in 1995. It specifies a set of tags that
must be supported by all browsers.
• In 1996, release of HTML 3.2 standard then later HTML 4.0 in 1997.
• Most web browsers today support variation of HTML known as
Extensible Hypertext Markup Language (XHTML) that support mobile
web application too. Today, there is HTML5 which many browsers anddevelopers are using to develop web applications.
1.1.2.Some of the key advantages of learning HTML
Create Web site: Someone can create a website or customize an
existing web template if he/she knows HTML well.
Become a web designer: If someone wants to start a carrier as a
professional web designer, HTML and CSS designing is a must skill.
Understand web: If someone wants to optimize the website, to boost
its speed and performance, it is good to know HTML to yield best results.
Learn other languages: Once the basic of HTML is understood then
other related technologies like JavaScript, php, or angular become easier to understand.
Application activity 7.2
1) HTML is not a programming language but can be thought of as a
presentation language. Explain.
2) What is the difference between Hypertext and Hyperlink?
3) What are the particularities of XHTML over HTML 4.01?4) Discuss the advantages of HTML 5 comparing to the previous versions.
1.2.HTML Syntax and HTML Page Structure
Activity 7.3
1. What is a HTML tag?
2. Give the syntax of HTML tag
3. What is the role of an attribute of a HTML tag?
Before adding content to the document, there’s a need of basic structure to set
up in a file. This structure isn’t only required for document to be compliant but
will also allow to provide useful information about the document.HTML Syntax
Hypertext Markup Language (HTML) documents use the .html or .htm
extensions. This extension allows a web browser or device such as a computer
or a smartphone to understand that HTML content is on the page, and the
content of the page is then rendered by the browser or device according to therules of HTML.
HTML tags are element names surrounded by angle brackets or Less Than
and Greater Than symbols (< >).
Syntax: <tag_name>content goes here...</tag_name>
Example: <title> My First page<title>
HTML tags normally come in pairs like <p> and </p>. The first tag in a pair is
the start tag, the second tag is the end tag. The end tag is written like the starttag, but with a forward slash inserted before the tag name.
Note: The start tag is also called an opening tag and the end tag a closing
tag. For example, to instruct a browser to present text as a paragraph, use the
<p> opening and </p> closing tags as follows: <p> This is a new paragraphseparated from others by a blank line</p>
1.1.1.HTML Page Structure
An element called HTML surrounds the whole document. This element contains
two sub-elements which are Head and Body. These elements are required to
form any HTML document
The Head contains the information about the HTML document like Title of the
page, version of HTML, Meta Data, etc while the Body contains everything to bedisplayed on the Web Page.
The basic structure of a HTML for every web page is shown below:
Explanation of each of the tag used in the above piece of HTML code: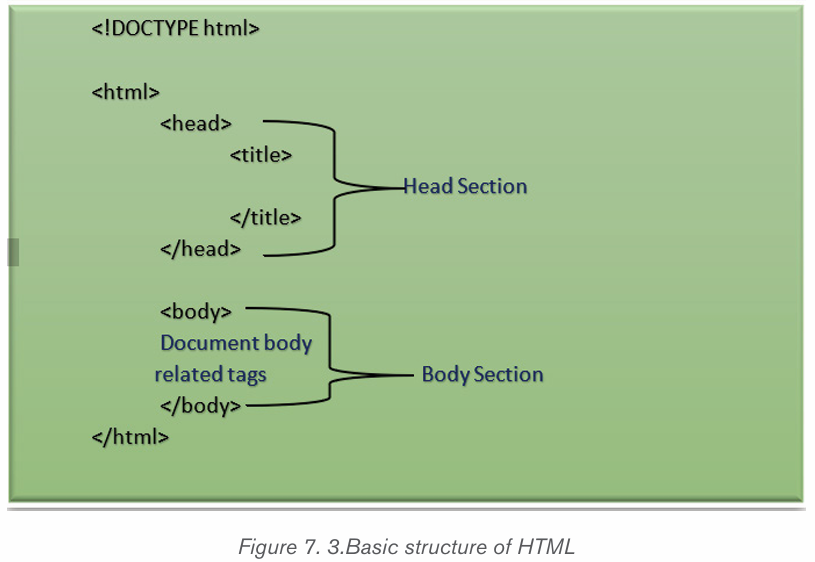
<!DOCTYPE html>: This tag is used to tells the HTML
version. This currently tells that the version is HTML 5.
<html>: This is called HTML root element and used to wrap all the code.
<head>: Head tag contains metadata, title, page CSS etc. All the HTML
elements that can be used inside the <head> elements are: <style>, <title>,
<base>, <no script>, <script>, <meta> that contain meta information aboutthe document.
1.1.1.Elements and Attributes Tags
Tags are comprised of elements and attributes. An element is an object on a
page such as a heading, paragraph, or image while attributes are qualities thatdescribe that element such as width and height.
Example of element tags:
An attribute is used to define the characteristics of an HTML element and is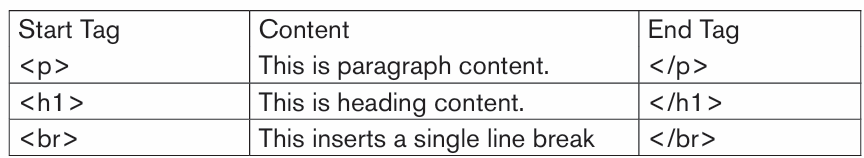
placed inside the element’s opening tag. All attributes are made up of two parts
a name and a value. The name is the property to set while the value is what youwant the value of the property to be set and always put within quotations.
The example below shows three possible values of align attribute: left,center and right.
<p align = «left»>This is left aligned</p>
<p align = «center»>This is center aligned</p><p align = «right»>This is right aligned</p>
Note: A few tags are called non-container tags, because they don’t contain
any content – they stand alone. Examples are images and line breaks. XHTML
is stricter than HTML, and requires that all open tags must be closed, even if
they’re not container tags. Therefore, non- container tags end in />. For example,
the tag for a line break is <br/>. HTML does not have this same requirement,
but it’s a good habit to get into in case you ever need to code in XHTML. Tags in
HTML are not case sensitive, but in XHTML all tags must be in lower case. Evenwhen coding in HTML, you should get in the habit of writing tags in lower case.
Application activity 7.3
1. Discuss the syntax of an HTML tag
2. Define an attribute
3. You are given the HTML statement below:
<font color=»green»> Hello Rwanda </font>
What is the function of:
a) Colorb) Green
1.1.Tags that identify and name documents
Activity 7.41. Using Notepad text editor, write the following HTML code and save
the file as mypage.html then run the file in a browser.
<! DOCTYPE html>
<html>
<head>
<title>Identifying elements</title>
</head>
<body>
<strong>Rwanda is known as a country of thousand hills! </strong>
<br>
<mark>The development of Rwanda is based on its people</
mark><br>
<del>strong and mark are HTML tags that organize web page contents</
del><br>
</body>
</html>
2. Study carefully the output of above HTML code and answer the following
questions:
1. What is the function of?
<strong> tag?
<mark> tag?
<del>tag?Give any other 2 HTML tags that identify and name a document.
TML language specification defines the markup that can be used to create
a webpage, the webpage author decides which elements they will use tomarkup content.
Basic HTML Headings
Heading tags are used in the body section to define section headings that stand out
from the rest of the text. HTML provided six levels of section headings i.e. (Size ofH6<H5<H4<H3<H2<H1)
The figure above shows how the headings appear when displayed on a browser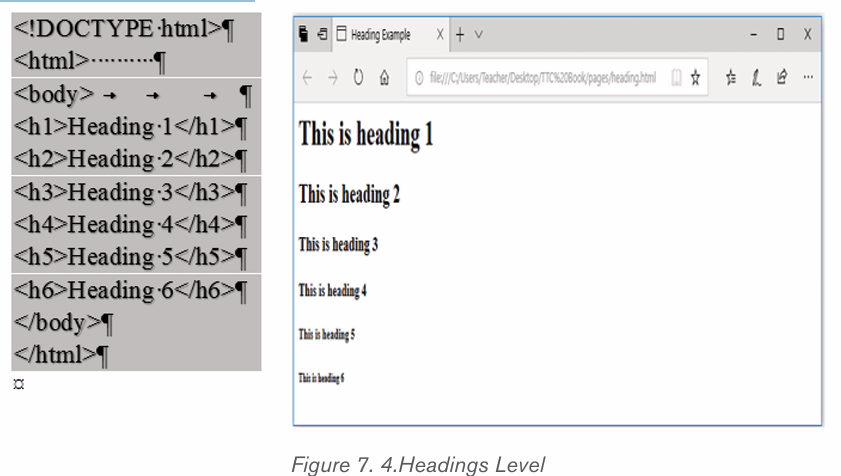
such as chrome or Mozilla Firefox.
1.1.1.Basic HTML Paragraphs and style
A paragraph always starts on a new line, and browsers automatically add some
white space (a margin) before and after a paragraph.
<p>This is a paragraph. </p>
<p>This is another paragraph. </p>
The HTML style attribute is used to add styles to an element, such as color,
font, size, and more.
<!DOCTYPE html>
<html>
<body>
<p>I am normal</p><p style=»color:red;»>I am red</p>
<p style=»color:blue;»>I am blue</p>
<p style=»font-size:50px;»>I am big</p>
</body>
</html>
The figure below shows how the Paragraph and style appear when displayed ona browser such as chrome or Mozilla Firefox
1.1.1.The appearance: Formatting Elements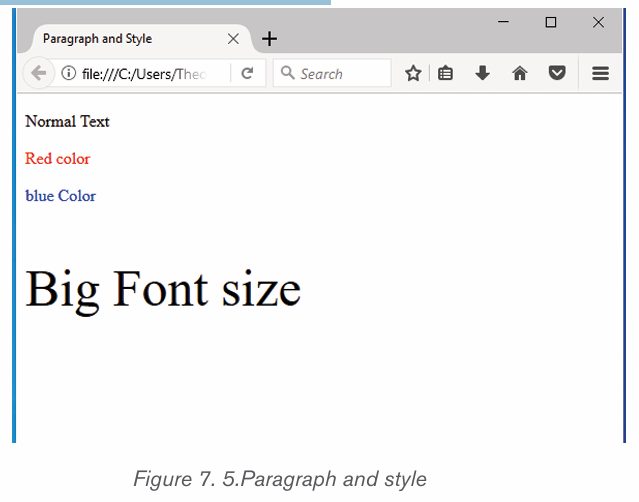
A document heading may be created by making text larger, bold and with a
different color. Presentational markup for such a heading may look like this:
<p>
< font size=”36” color=” red” > <b>ICT is a key of development </b>
</font> </p>
Formatting elements were designed to display special types of text:The table below shows html text formatting elements:
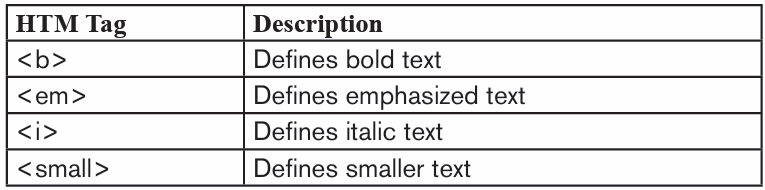
UP TO HERE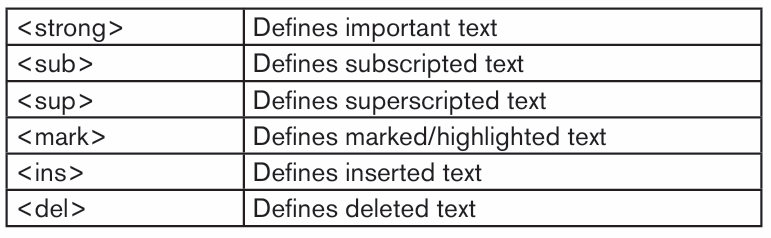
Example: The HTML document below shows how to use formatting HTML
elements
<!DOCTYPE html>
<html>
<head>
<title>Formatting elements</title>
</head>
<body>
<mark><b>Rwanda has 4 provinces and Kigali City</b></mark> <br>
<strong>Kigali City has 3 districts</strong><sup> which ones? </sup><br>
<del>Kigali Convention Center is in Nyarugenge district</del><br>
<ins>Thank you! </ins>
</body></html>
1.1.1.HTML images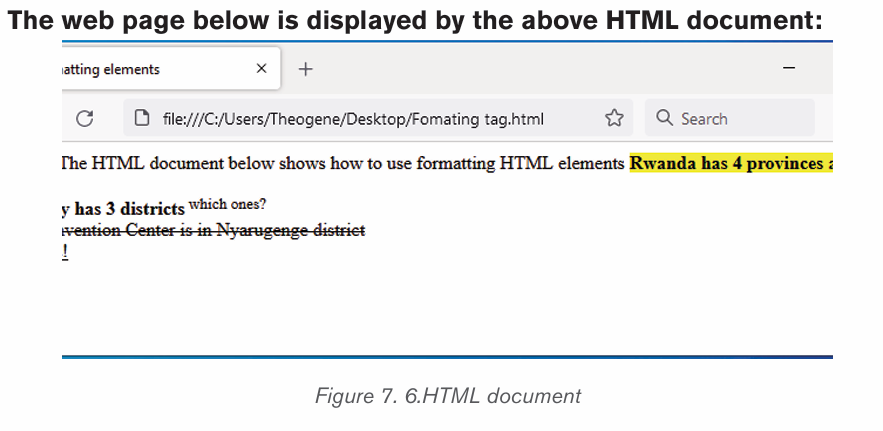
One of the most compelling features of latest HTML standard is the ability to
embed images that make a website more attractive. The three types of images
supported by HTML4 are GIF (Graphics Interchange Format), JPEG (Joint
Photographic Experts Group) and PNG (Portable Network Graphics). To insert
an image onto a web page, use the <img> tag; img is an abbreviation of the
word image. The <img> is an empty tag does not require a corresponding
closing tag. The general syntax for inserting a graphical object or image is:
<img src=”Image URL” ... attributes-list/>
The src in the img tag is an important attribute that specifies the location(source) or URL of the image to insert onto the page.
For example, the following HTML code displays an image called Volcano:
<!DOCTYPE html>
<html>
<head>
<title> Visit Rwanda </title>
</head>
<body>
<p><Strong><font color=»red» size=48>
Visit Volcanoes National Park</font></strong></p>
<center><img src=»volcano.png»alt=»Gorilla in Rwanda» />
</center>
</body>
</html>The HTML document above produces the following output:
NB: use of the alt attribute is a good practice to specify alternate text for an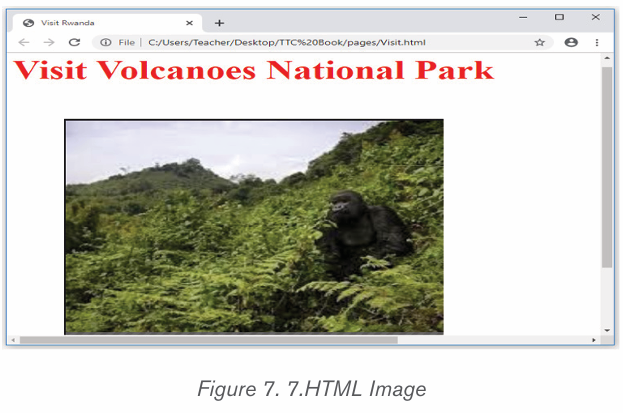
image, if the browser cannot display or locate the image.
1.1.1.Setting Image size
It is possible to specify the size using width and height attributes. The two
attributes set width and height of the image in terms of pixels or percentage of
its actual size. For example, to set the size of the volcano.png to occupy quarter
of the screen, use:
<img src=”volcano.png” width = “ 80%” height=”90%”alt=”Gorilla in Rwanda”
/>
1.1.1.Image Alignment
The <img> tag uses the align attribute to align an image on top, bottom, left or
right of the browser window. For example, to align the volcano.png on top of the
page, use align attribute as follows:
<img src=”volcano.png” align=” top”alt=”Gorilla in Rwanda” />
Notice: with HTML it is possible to set page background color; bgcolor
attribute is used within body element.
For example, the following html code explains how bgcolor attribute is used
while setting yellow color as the page background.
<! DOCTYPE html>
<html>
<head>
<title>MY First page</title>
</head>
<body bgcolor=»Orange»>
<h1><font color=»red» size=»72»>Background Color of this page is
Orange!!</h1>
</body>
</html>The above html document displays the following web page in a browser:
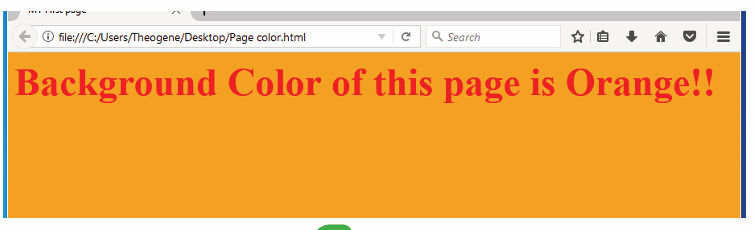
Application activity 7.4
1. Using heading, paragraph, font and image elements create a page
that briefly describes a topic that you would like to cover in yoursmall website. The website should contain information such as:
a) Institution Descriptions,
b) Mission
c) Vision
d) Institution Logo.
2. Discuss the function of the following attributes in <font> tag:
a) Color attribute
b) Size attribute3. Explain the role of src, alt, and align attributes within <img>tag
1.1Organize web page contents using HTML tag and hyperlinks
Activity 7.5
1. Type and execute the HTML code below, observe the output and
explain the way page content is organized.
<! DOCTYPE html>
<html>
<head>
<title>list</title>
</head>
<body bgcolor=»yellow»>
<p><Strong> The most common colour names are </strong></p>
<ol >
<li>Red. </li>
<li>Orange. </li>
<li>Yellow. </li>
<li>Green. </li>
<li>Cyan. </li>
<li>Blue. </li>
<li>Magenta. </li>
<li>Purple. </li>
</ol>
</body>
</html>Observe the following list of items and give its type
Activity 7.5
1. How do you call a list which is written inside another list?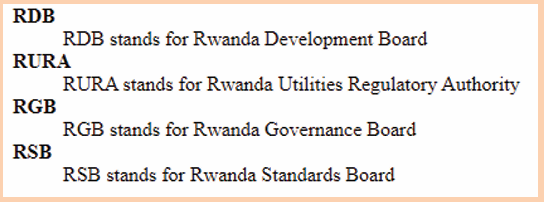
2. Using HTML code, write the above list
This section discuss, some HTML elements that describe the structure and
organize web contents. The information can be displayed in numbered or
bulleted list. HTML supports three types of lists namely ordered list, unorderedlist, and definition list.
Ordered <ol> list is a container for enumerated items ordered using numbers such as
1, 2, 3.
Unordered list <ul> is a collection of related items that have no specialorder or sequence.
Definition list <dl> is used for definitions such as glossaries that paireach label with some kind of description.
1.1.1.Creating ordered list
To create an ordered list, use the <ol>...</ol> tags within which to include oneor more <li>...</li> (list item) tags.
Example:
<!DOCTYPE html>
<html>
<head>
<title>Numbered List</title>
</head><body bgcolor=cyan>
<p><Strong><font color=”blue” size=6 face=»Cooper»>
Easter African Community (EAC) has 6 Partner States:</font></strong></
p>
<ol>
<li>Rwanda</li>
<li>Uganda</li>
<li>Burundi </li>
<li>Kenya</li>
<li>Tanzania</li>
<li>South Sudan</li>
</ol>
</body>
</html>
The figure below shows the ordered list of 6 <li> Countries after displaying thepage on a browser:
It is possible to customize the numbering style of an ordered list using the type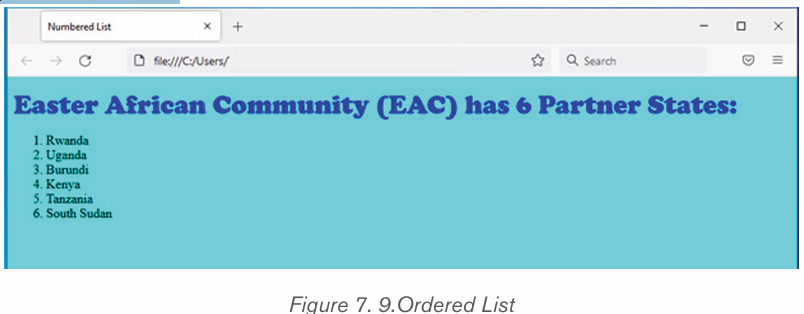
attributes as follows:
<ol type = “counter-type”>....</ol>
<ol type = “a”> ...</ol>
<ol type = “i”> ...</ol>
Examples: using above html document change only “<ol> “replaced by <ol type
=”I”>The page on a browser automatic changed as below:
1.1.2Creating unordered list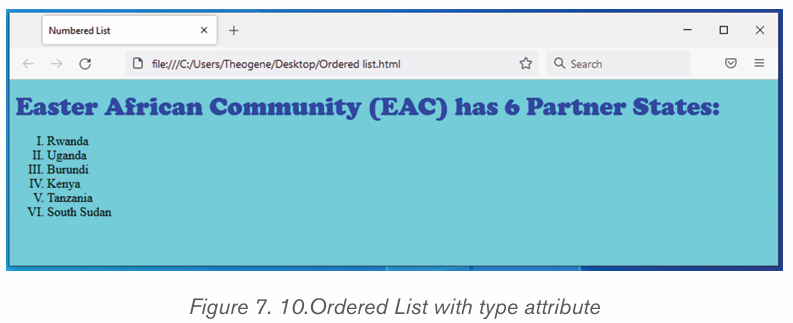
Unordered list is similar to ordered list only that the items are listed using bullets.
To create unordered list, use <ul>...</ul> instead of <ol>..</ol> element
Example:
<!DOCTYPE html>
<html>
<head>
<title>bulleted List</title>
</head>
<body bgcolor=pink>
<p><Strong><font color=»red» size=6 face=»Cooper»>
Easter African Community (EAC) has 6 Partner States:</font></strong></
p>
<ul>
<li>Rwanda</li>
<li>Uganda</li>
<li>Burundi </li>
<li>Kenya</li>
<li>Tanzania</li>
<li>South Sudan</li>
</ul>
</body>
</html>
The figure below shows the unordered list of 6 Countries after displaying thepage on a browser:
Unordered list: It is possible to customize unordered lists using type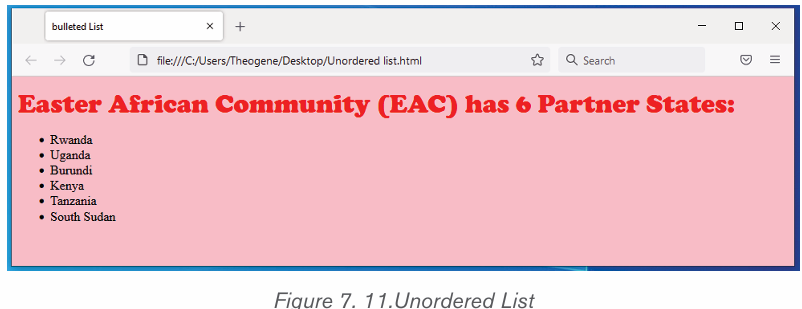
attribute and values that denote bullet types such as disc, square, or
circle. For example, to change the bullets displayed in above figure
from round to square, use the following syntax:
<ul type = “bullet-type”>....</ul>
For example, to display unordered list shown in figure above as a square, bullets,
use the style attribute for example like <ul type = “square”> ..</ul> in abovehtml document; Then Page on browser will be change as follow:
1.1.1.Creating definition list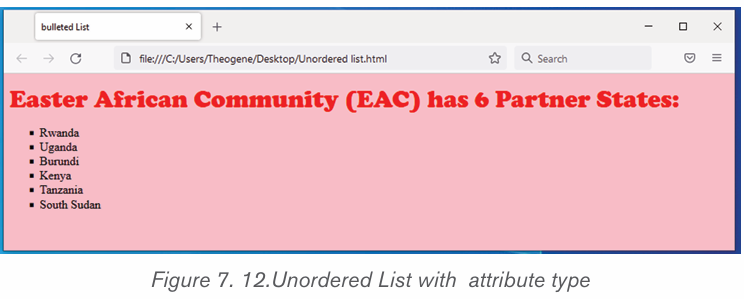
A definition list is used to present a glossary of terms, or other definition lists like
Dictionary and encyclopedia. To create a definition list, use <dl> ...</dl>
element in which you place <dt> ... </dt> to mark up the term and <dd> ... </dd> to mark up the definition part.
Therefore, a definition list consists of the following parts:
• <dl> - Defines the start of the list
• <dt> - A term
• <dd> - Term definition
• </dl> - Defines the end of the list
For example, the following HTML document shows a definition list of four terms:
<!DOCTYPE
<!DOCTYPE html>
<html>
<head>
<title>Definition list </title>
</head>
<body>
<dl>
<dt><b>ICT </b></dt>
<dd>ICT stands for Information and Communication Technology</dd>
<dt><b>HTML</b></dt>
<dd> HTML stands for Hyper Text Markup Language</dd>
<dt><b>JPEG</b></dt>
<dd>JPEG stands for Joint Photographic Experts Group</dd>
<dt><b>CSS</b></dt>
<dt><b>CSS</b></dt>
</dl>
</body></html>
1.1.1.Creating nested lists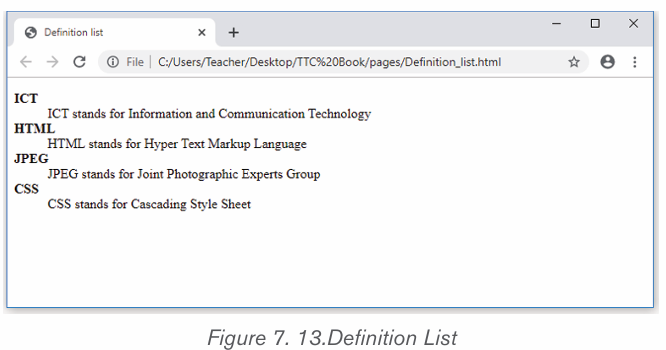
To create a nested list, put the entire list structure inside another list
Example:
<!DOCTYPE html>
<html>
<head>
<title>sample Nested List </title>
</head>
<body>
<p><Strong><font color=»blue»size=48>
HTML-BASED WEB</font></strong></p>
<ol>
<li>World wide web</li>
<li>Organization</li>
<li>Introduction to HTML</li>
<li>
<ul>
<li>Definition of HTML</li>
<li> HTML Syntax</li><li>Doc structure</li>
<li>Headings</li>
<li>Paragraphs</li>
<li>HTML Comments</li>
</ul>
</li>
<li>Hyperlinks</li>
<li>Advanced HTML</li>
</ol>
</body></html>
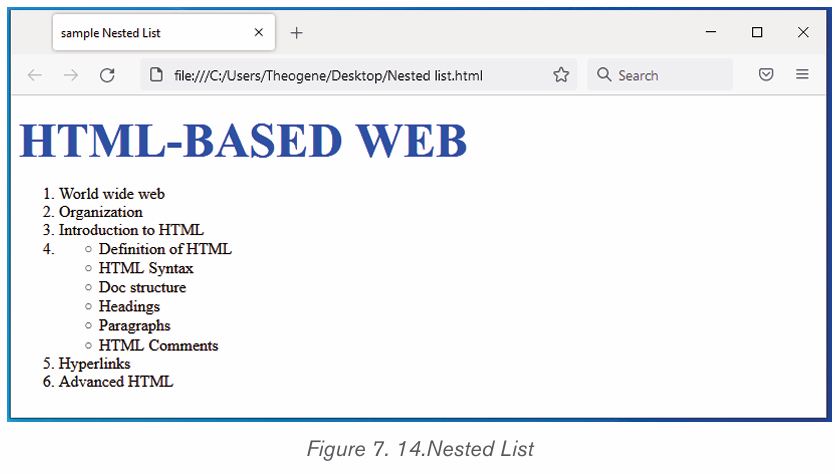
Application activity 7.5
Study the following HTML document and answer related questions:
<! DOCTYPE html>
<html>
<head>
<title>list</title>
</head>
<body bgcolor=”yellow”>
<p><Strong> Fruits Menu:</strong></p>
<ul >
<li>Orange</li>
<li>Banana</li>
<li>Guava</li>
<li>Mango</li>
</ul>
</body></html>
1. Write and execute the above html code then specify the type of a list
2. Write the same html code and change it into ordered list using capital letter types.
3. Give a clear difference between:
i. Definition and Nested list
ii. <dt>…</dt> and <dd>…</dd> tags
4. Study the following web page and write its HTML code which displays it into browser.
1.1.HTML Frame and table Tags
Activity 7.6
1. By searching from internet, differentiate Frame and table2. Write HTML code that display the below table
HTML frames are used to divide the the browser window into multiple sections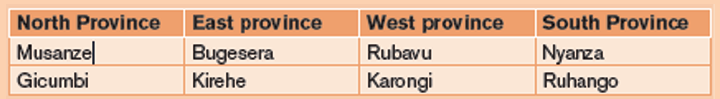
where each section can load a separate HTML document. A collection of frames
in the browser window is known as a frameset. The window is divided intoframes in a similar way the tables are organized: into rows and columns.
1.1.2.Creating Frames
To use frames on a page we use tag instead of tag. The tag defines how todivide the window into frames.
• The rows attribute of tag defines horizontal frames.
• the cols attribute defines vertical frames. Each frame is indicated bytag and it defines which HTML document shall open into the frame.
<!DOCTYPE html>
<html>
<head>
<title>HTML Frames</title>
</head>
<frameset rows=»25%,50%,25%»>
<frame name=»top» src=»Nested list.html» />
<frame name=»main» src=»Page color.html» />
<frame name=»bottom» src=»Ordered list.html» />
<noframes>
<body>
Your browser does not support frames.
</body>
</noframes></frameset></html>
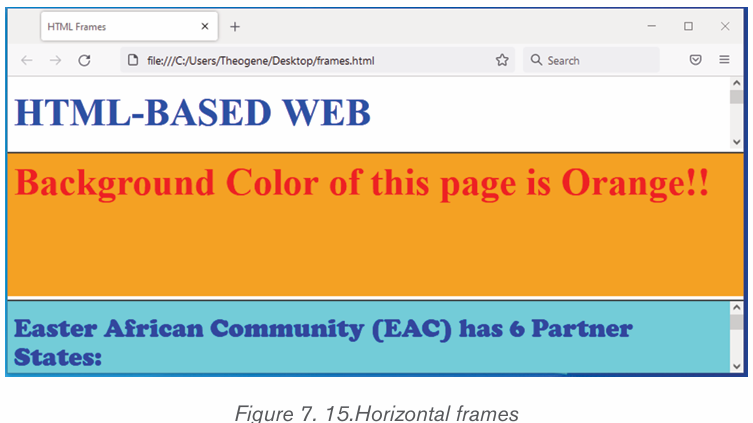
1.1.1.Creating Frames
Let’s put above example as follows, here rows attribute was replaced by columns
and changed their width. This will create all the three frames vertically:
<!DOCTYPE html>
<html>
<head>
<title>HTML Frames</title>
</head>
<frameset cols=»25%,50%,25%»>
<frame name=»left» src=»Nested list.html» />
<frame name=»center» src=»Page color.html» />
<frame name=»right» src=»Ordered list.html» />
<noframes>
<body>
Your browser does not support frames.
</body>
</noframes></frameset> </html>
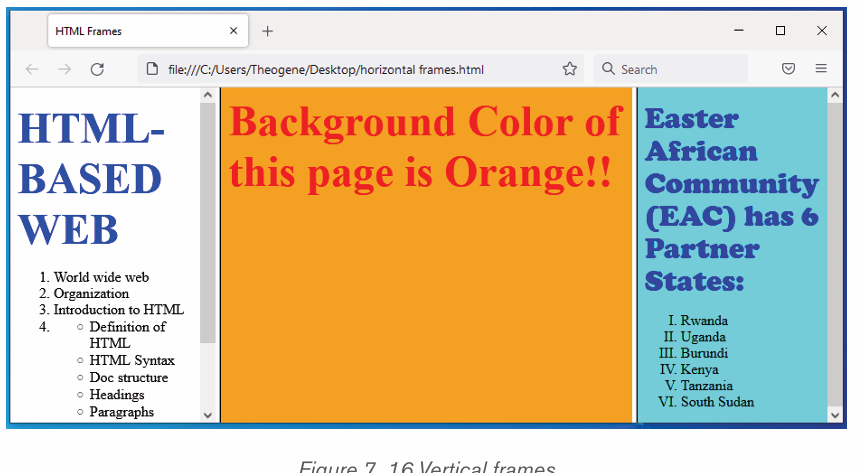
1.1.1.HTML Table tags
Tables are used to organize data such as numbers, text, links and images into
rows and columns. An intersection of a row and a column forms data cell in
which table data is held. The HTML tables are created using the <table> tag in
which the <tr> tag is used to create table rows and <td> tag is used to create
data cells. The elements under <td> are regular and left aligned by default.
Before creating a table, consider the following table-features:
Caption: indicates the type of data presented in the table <caption>…</caption>
headings: the row that indicate the data displayed in each column
<th> ...</th>Cells intersection of rows and columns in which we insert data .
<!DOCTYPE html>The HTML document above produces the following table:<html>
<head>
<title>Table </title>
</head>
<body>
<table border=”2” cellpadding=»10» cellspacing=»3»>
<Caption><b>Hotel Employee’S Information</b></caption>
<tr>
<th>Employee Name</th>
<th>Depertment</th>
<th>Salary</th>
</tr>
<tr>
<td>MUTWARASIBO</td>
<td>Finance </td>
<td>250000</td>
</tr>
<tr>
<td>KIZERE</td>
<td>Marketing</td>
<td>200000</td>
</tr>
<tr>
<td>UWIHANGANYE</td>
<td>Information Technology </td>
<td>400000</td>
</tr>
</table>
</body> </html>
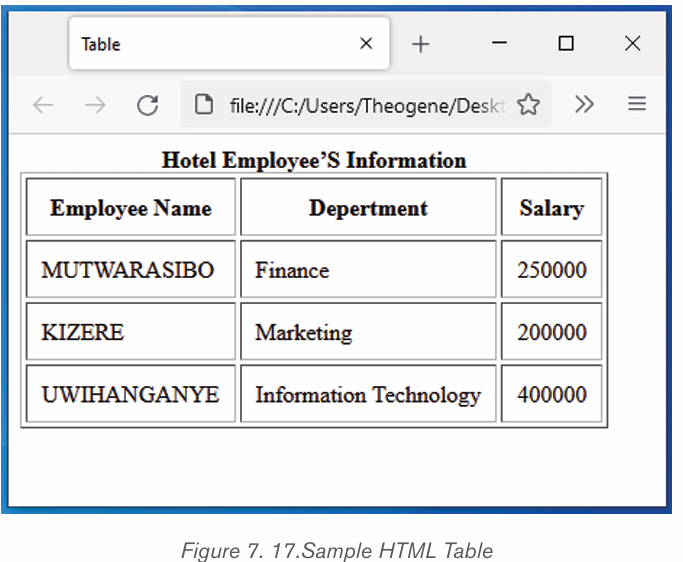
a) Define or format a HTML table
The following are basic attributes used to define or format a HTML table:
Border Attribute: Numeric values that specify thickness of the border
that surrounds all the table cells. If 0 is used, the border is invisible while.
Example <table border=”2” >
Height and Width attributes
To set the size of the table, use width and height attributes. For example,
the statement below sets the table size to width of 400 pixels and height of
150 pixels.
<table border=”2” width=”400” height=”150”>
Cellpadding Attribute: Specifies the space, in pixels, between the
cell wall and the cell content.
cellspacing attribute: which specifies the space between cells.
Syntax: <table cellpadding=”pixels”>a) Table Caption
Colspan attribute: Specifies the number of columns a cell should
span. It allows the single table cell to span the width of more than one
cell or column. It provides the same functionality as “merge cell” in the
spreadsheet program like Excel. It can be used with <td> and <th>
element while creating a HTML table.
Syntax: <td colspan =”value”> table content...</td>
<th>: The colspan attribute when used with <th> tag determines the
number of header cells it should span.
Syntax: <th cospan =”value”> table content...</th>
The value specifies the number of columns that the cell fills. The value
must be an integer
Rowspan attribute: Specifies the number of rows a cell should
span. That is if a row spans two rows, it means it will take up the space
of two rows in that table. It allows the single table cell to span the
height of more than one cell or row. It provides the same functionality
as “merge cell” in the spreadsheet program like Excel. It can be used
with <td> and <th> element in a HTML table.
<td>: The rowspan attribute when used with <td> tag determines thenumber of standard cells it should span. Syntax:
<td rowspan = «value»> table content...</td>
The value specifies the number of rows that the cell fills. The value must
be an integer.
<th>: The rowspan attribute when used with <th> tag determines the
number of header cells it should span. Syntax:
<th rowspan = «value»>table content...</th>
The value specifies the number of rows that the cell fills. The value mustbe a integer.
Example: The following HTML code explains how to use HTML table attribute discussed above:
<!DOCTYPE html>
<html>
<head>
<title>Table attributes </title>
</head>
<body>
<table border=»4» cellpadding=»3» cellspacing=»3»
width=»400»height=»200»>
<Caption><b>School Administration report</b></caption>
<tr>
<th colspan=6>Number of school Administrators</th>
</tr>
<tr>
<th colspan=2>Teacher</th>
<th colspan=2>Officers</th>
<th colspan=2>Total number</th>
</tr>
<tr>
<th>Male</th>
<th>Female</th>
<th>Male</th>
<th>Female</th>
<th rowspan=»2»>40</th>
</tr>
<tr>
<td>19</td>
<td>7</td>
<td>4</td>
<td>10</td>
</tr>
</table>
</body></html>
The above HTML code produces the output below:
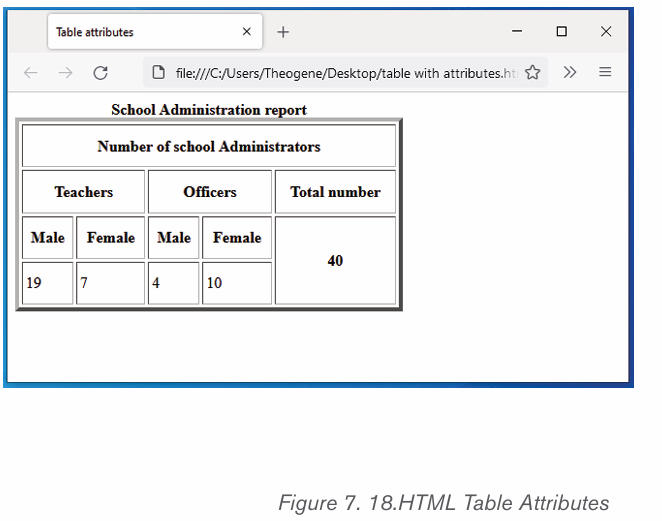
Application activity 7.6
1. Discuss the use of the following tags and attributes:
a. <Frameset> tag
b. <Caption> tag
c. Colspan attribute
d. <Th> tag
1. Create an html document which create a web page with three
frames named: «Top_Frames «,»Main_Frames «,and»Bottom_ Frame».
1.1.HTML Forms
Activity 7.7
A website is developed with different pages; the page below is createdusing HTML language. Observe it and answer related questions.
1. What do you understand a HTML form?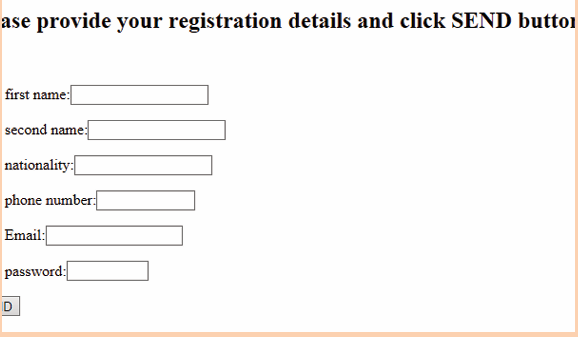
2. What is the use of HTML form?3. . Use HTML code to produce the above page
A person may need to gather information such as student’s details and store
such information in the server. The most common method for gathering suchinformation is by using a form.
1.1.1.Form Attributes
Html Form elements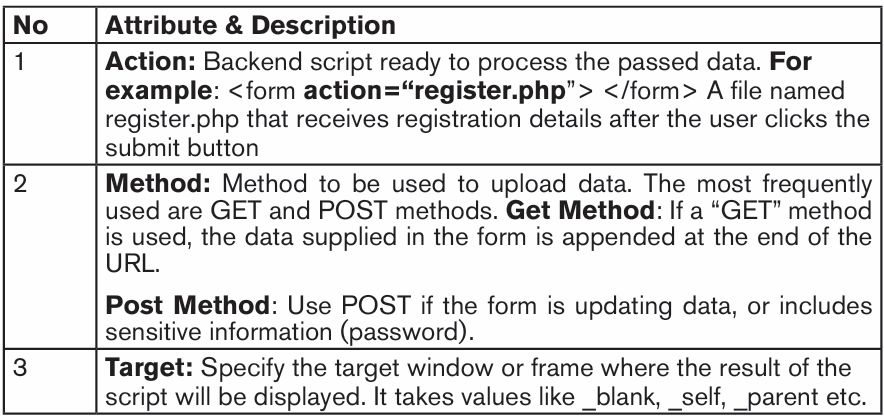
The most common controls include: text, text area, select, radio buttons,
checkboxes, file select, command button and reset buttons.Let see the use of every form element and basic form attributes
i) The <input> Element
An <input> element can be displayed in many ways, depending on the type attributes.Here are some examples:
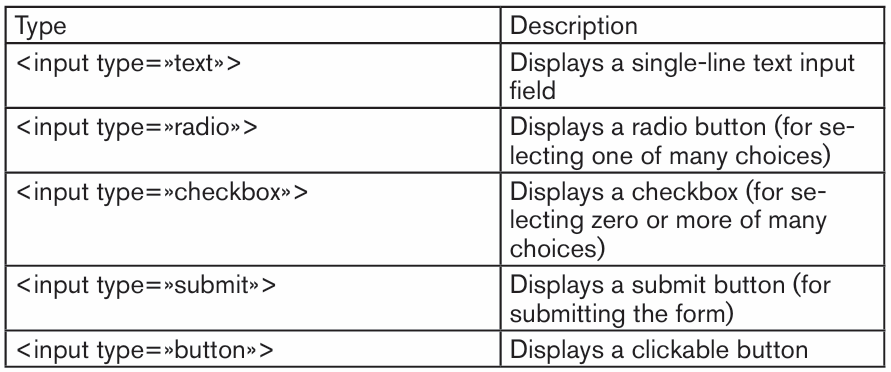
Text Input Controls
There are three types of text input used on forms
Single-line text input controls This control is used for items that
require only one line of user input, such as search boxes or names. Theyare created using HTML <input> tag
Password input controls This is also a single-line text input but it masks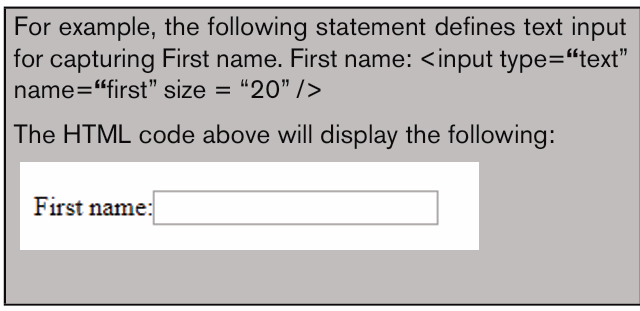
the character as soon as a user enters it. They are also created using HTMl<input> tag but type attribute is set to password. Example
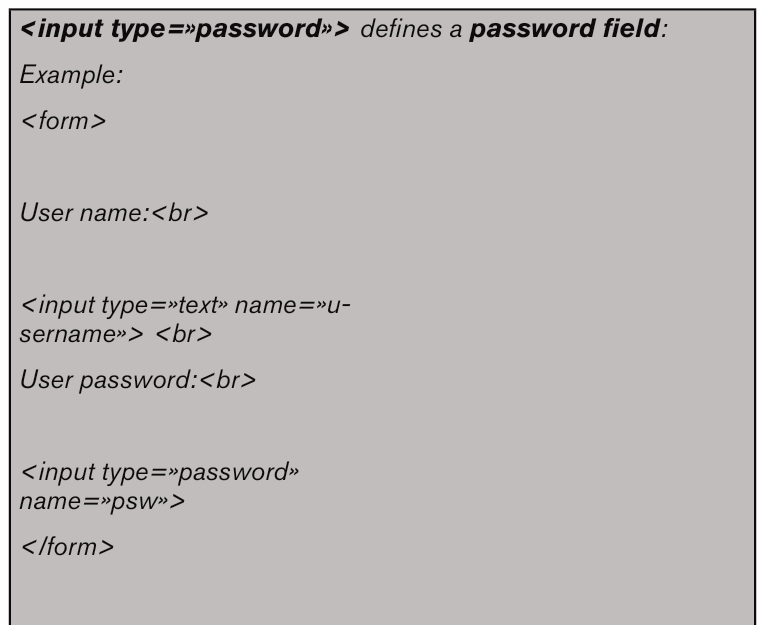
Multi-line text input controls This is used when the user is required to give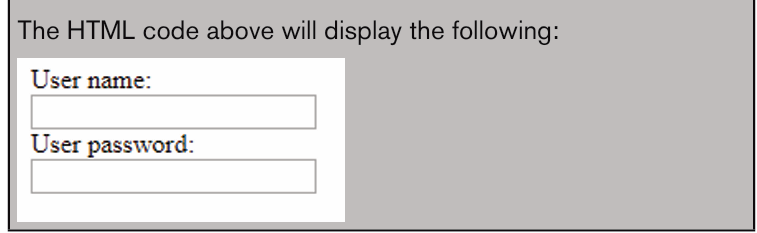
details that may be longer than a single sentence. Multi-line input controls are
created using HTML <textarea> tag. The attributes used with textarea tagare: name, rows, and cols.
Checkbox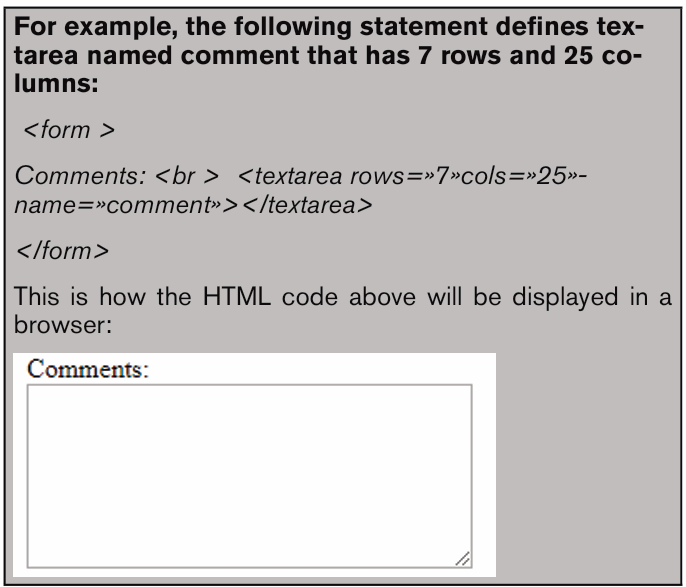
Checkboxes are used when more than one option is required to be selected. They
are also created using HTML <input> tag but type attribute is set to checkbox
value as shown by the following statements:
<! DOCTYPE html>
<HTML>
<HEAD><TITLE>Checkbox</TITLE>
</HEAD>
<BODY>
<P><Strong><font color=»green» size=36>Choose your favorite games</
font></strong></p>
<form>
<p><input type=»checkbox» name=»game» checked=»checked»> Football
</p> <p><input type=»checkbox» name=»game» > Basketball <p>
<p><input type=»checkbox» name=»game» > Volley Ball<p>
<p><input type=»checkbox» name=»game» > Net Ball<p>
</form>
</BODY></HTML>
Radio button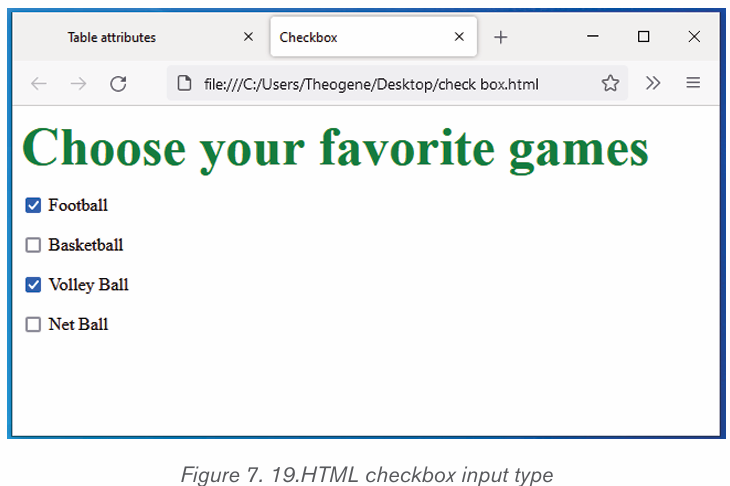
Radio buttons let a user select ONLY ONE of a limited number of choices.
<input type=»radio»> defines a radio button. Example:
<!DOCTYPE html>
<HTML>
<HEAD><TITLE>radio buttons</TITLE>
</HEAD>
<BODY>
<P><Strong><font color=»purple» size=36>Select your subject</
font></strong></p>
<form>
<input type=»radio»name=»sex» value=»physics»checke
d=»checked» > Math </br>
<input type=»radio»name=»sex» value=»Math»»>Physics </br>
<input type=»radio»name=»sex» value=»Accounting»»>Accounting
</br>
</form>
</BODY>
</HTML>The HTML code above will be displayed in a browser as follows:
Select Box Control/ (Drop-Down List)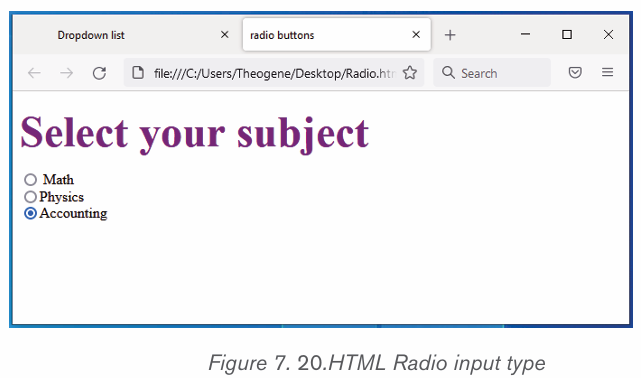
The select control also known as dropdown box provides the user with various
options in form of drop-down list, from which a user can select one or more
options. For example, the following select defines a dropdown for selecting only
one option:
<! DOCTYPE html>
<HTML>
<HEAD><TITLE>Dropdown list</TITLE>
</HEAD>
<BODY>
<P><Strong><font color=»Orange» size=36>
Select your residence province:</font></strong></p>
<form>
<select name=»dropdown»>
<option value=»Kigali» selected>Kigali City</option>
<option value=»South»>South Province</option>
<option value=»North»>North Province</option>
<option value=»Easter»>East Province</option>
<option value=»West»>West Province</option>
</select>
</form>
</BODY>
</HTML>The HTML document above produces the following webpage:
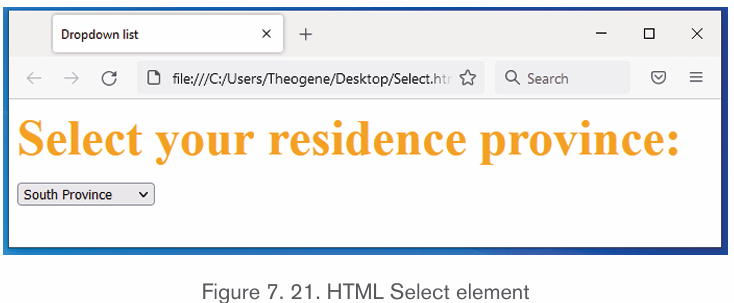
When you click on drop down arrow of a box, it will be as follow
Submit and Reset Button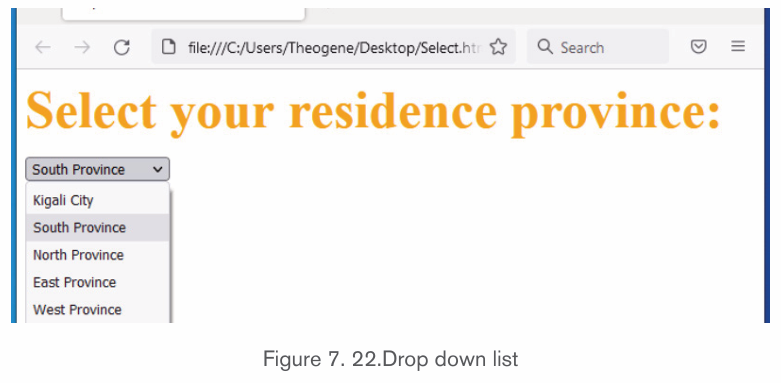
Submit input type used to create a button that automatically submits form
data to web server. On the other hand, reset is used to refresh (reset) form
controls to their default values. The following statements creates submit and
reset buttons with values set to Send and Reset respectively:This is how the HTML code above will be displayed in a browser:
The following is a HTML document that implements input text box, input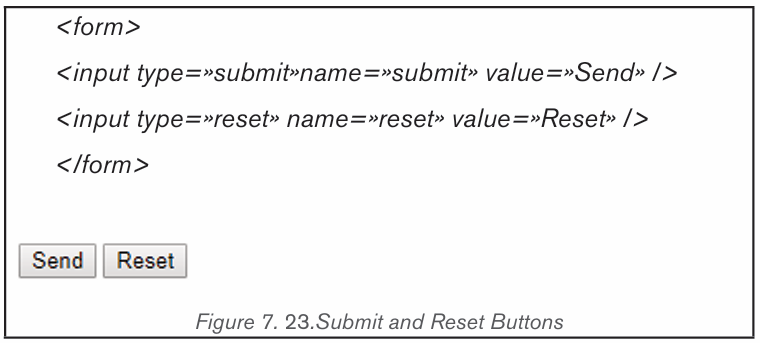
password box, checkbox, radio buttons, select, text area and action buttons(Submit and Reset)
<!DOCTYPE html>
<HTML>
<HEAD><TITLE>Detailed_form page</TITLE>
</HEAD>
<BODY bgcolor=pink>
<h2><Font color=»green» size=6>Please provide your registration details
</font></h2>
<form action=»register.php»method=»post»>
<p><b>Your first name:</b><input type=»text» name=»first»size=20></p>
<p><b>Your second name:</b><input type=»text» name=»second»size=20></
p>
<p><b>Your username:</b><input type=»text» name=»mail»size=13></p>
<p><b>Your password:</b><input type=»password» name=»pass»size=10
></p>
<p></u><b>choose your interested subjects:</b></u></p>
<input type=»checkbox» name=»check»checked=»checked»>Accounting
<br>
<input type=»checkbox» name=»check»>Biology<br>
<input type=»checkbox» name=»check»>Physiscs<br>
<input type=»checkbox» name=»check»>Chemistry<br>
<input type=»checkbox» name=»check»checked=»checked»> Fundamentals of
Nursing
<p></u><b>Select your sex:</b></u></p>
<input type=»radio»name=»sex» value=»male»checked=»checked» > Male
<input type=»radio»name=»sex» value=»female»»>Female
<p></u><b>Select your residence district:</b></u>
<select name=»dropdown»>
<option value=»Gasabo» selected>Gasabo District</option>
<option value=»Nyarugenge»>Nyarugenge District</option>
<option value=»Kicukiro»>Kicukiro District</option>
</select></p>
<p><b>Comments:</b><br>
<textarea rows=»3»cols=»15»name=»comment»></textarea>
</p>
<p><b>If you have provided all required information click
<input type=»submit»name=»submit» value=»Send» /></p>
<p><b>If you want to reset your form click
<input type=»reset»name=»reset» value=»Clear» /></p>
</form>
</body></html>
The above HTML document produces the following web page:
Notice: It is possible to organize the HTML form elements using a table so that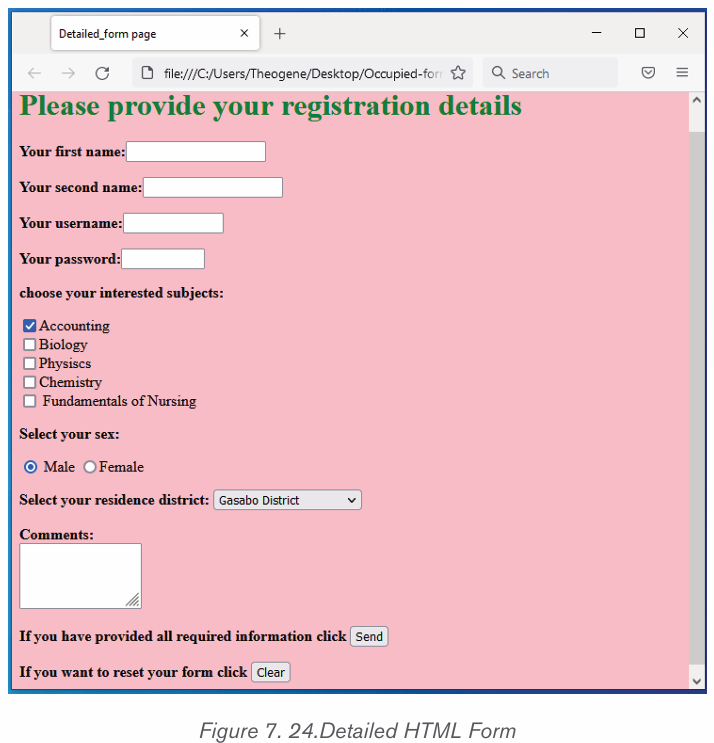
they can be well arranged.
For example, HTML document below explains how you can insert an html
form in a table:
<! DOCTYPE html>
<html>
<head>
<title> Registration</title>
</head>
<body>
<center>
<h1> <font color=»blue»>Please provide the following details</
font></h1>
<table><form Action= «register.php» Method= «get» >
<tr><td>First Name:</td> <td><input type= «text» name=
«FName» size=»15»></td></tr>
<tr><td>Last Name:</td> <td><input type= «text» name=
«lname»size=»15»></td></tr>
<tr><td>Nationality:</td> <td> <input type=»text»name=
«country» size=»25»></td></tr>
<tr><td>Phone:</td> <td> <input type= «text» name= «phone»
size=»15»></td></tr>
<tr><td><input type=»checkbox» name=»subjects» checke
d=»checked»></td> <td> Computer Science</td></tr>
<tr><td><input type=»checkbox» name=»subjects» ></td> <td>
Physics</td></tr>
<tr><td><input type=»checkbox» name=»subjects» ></td> <td>
Economics</td></tr>
<tr><td><select name=»dropdown»> <option value=»maths» se
lected>Mathematics</option>
<option value=»computer»>Computer Science</option> </se
lect> </td></tr>
<tr><td>Comments:</td> <td> <textarea rows=»3»cols=»10»
name=»comment»> </textarea></td></tr>
<tr><td><input type=»submit» name=»submit» value=»Send»></
td></tr> </form></table>
</center>
</body></html>
The HTML code above displays the following page in a browser:
Application activity 7.7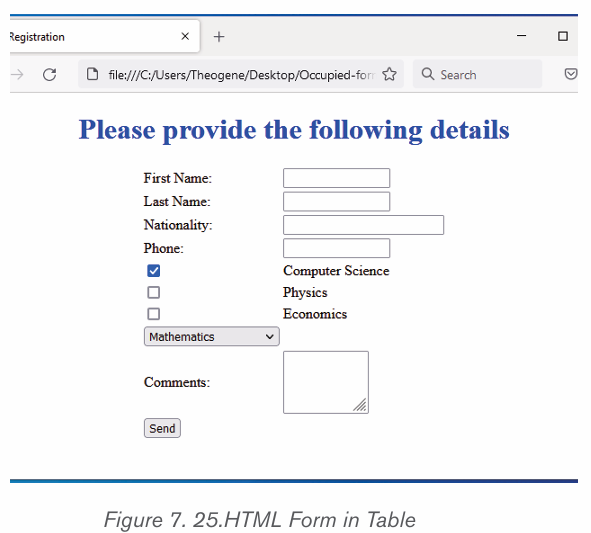
1. Explain the following HTML tag and attributes:
a. Action attribute
b. Method attribute
c. Text area tag
2. Write the syntax of select HTML tag3. Write the HTML code that displays the form below:
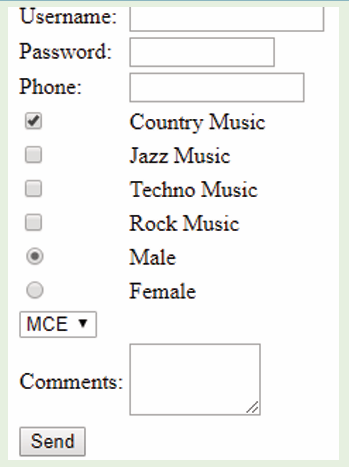
1.1.Creation of links
Activity 7.8
1. A website is a collection of several web pages with
information on a subject that are connected (linked)
together. What do you understand by a link?
2. What is difference between internal and external link?
A hyperlink is a text, phrase or image that is clicked on in order to go to another
web page or a section within the current page or to another website. In most
browsers, hyperlinks are often in blue and underlined.
a) HTML Links – Syntax
To create a hyperlink, use the anchor element: <a>...</a>. The <a> tag is
called an anchor tag because it is used to create anchors for hyperlinks.
<a href=”url”>link text</a>
Example:
<a href=”http://www.irembo.gov.rw”>Irembo Official Website</a>
The href (Hypertext Reference) attribute specifies the destination address
(http://www.irembo.gov.rw”). The link text is the visible part (Irembo Official
Website). Clicking on the link text, will send the page visitor to the specified
address.
a) Local Links
The example above used an absolute URL (A full web address).
A local (internal) link (link to the same web site) is specified with a relative URL
(without http://www....).The following code shows how to add text-based hyperlink into a HTML page:
<!DOCTYPE html>
<html>
<head>
<title>Hyperlink page</title>
</head>
<body bgcolor=black>
<p><font color=»orange» size=”20”> For getting more information
Click following link:
</font></p>
<a href=»http://www.igihe.com»>Visit Tutorial Site</a>
</body></html>
The figure below shows how the link is displayed on the browser
In most browsers, a hyperlink is an underlined text and blue in color. In our case,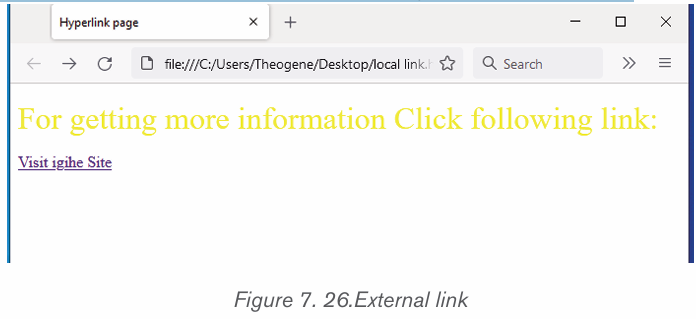
once the visitor clicks on the link, he or she is taken to the web page of thetutorial site as long as it is a valid URL.
Example 2:
Example 2:
<! DOCTYPE html>
<html>
<head>
<title>Hyperlink page</title>
</head>
<body>
<p><font color=»black» size=»3» face=»Goudy Stout»> Click following link
for more information:
</font></p>
<a href=»Occupied-form.html»>click here</a>
</body></html>
Output of above html code:
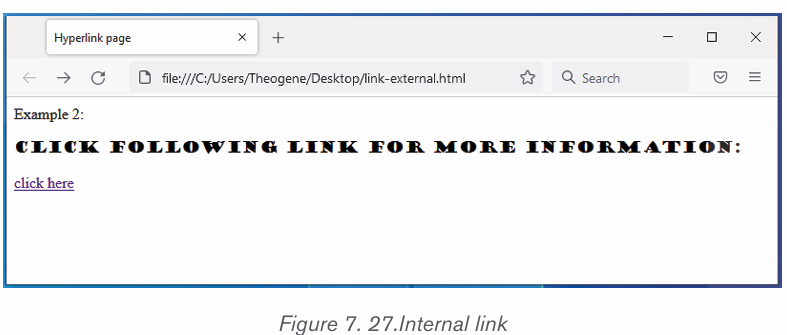
The click here hyperlink fall on the following frame.html page:
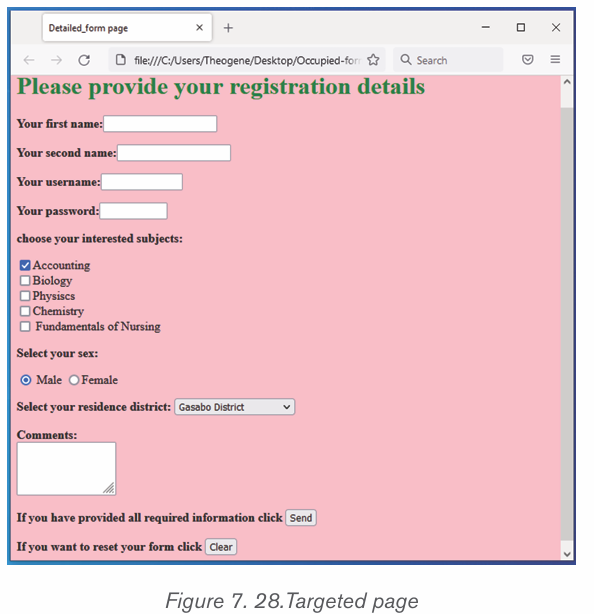
Application activity 7.8
1. Define the following terms:
a. Hyperlink
b. Hypertext
c. Href attribute
2. What do you understand by a local link?
3. Explain this statement: <a href=»photo.html»> image link</a>
4. Create two static web pages and hyperlink called “next” whichlinks them
1.1.Back-end vs Front end
Activity 7.9
With research on internet, discuss the difference between Front end andBack end in the web site design and development process.
Database systems are comprised of a Front End and Back End. The Back End
has the tables that stores data, including the relationships between the tables,
data queries and other behind the scenes technology that accepts information
from and displays information to the user via the Front End.
For example, when someone is requesting for a birth certificate through Irembo
there is a number of information provided through different forms and thatinformation is kept in the Irembo database tables.
The front end is the part of the website, users can see and interact with. Back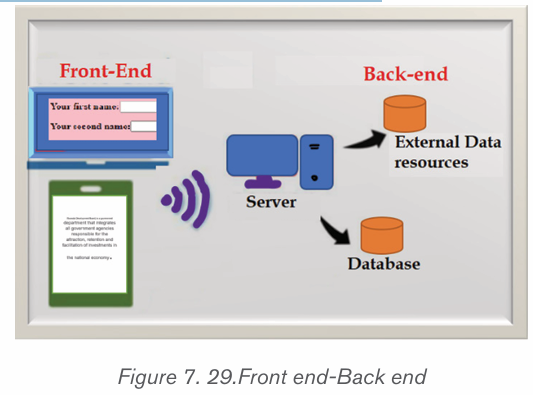
end, on the contrary, is the part of the website users cannot see and interact
with.
Front end development is programming which focuses on the coding and
creation of the visual elements of a website or app that a user will interact with
(the client side). In contrast to front end development, back-end developmentfocuses on the side of the website users can’t see.
The back end can also be referred to as the “server side” of a website. As an
example, let’s say that someone is running a social media website. he/ she
needs an accessible place to store all of users’ information. This storage center
is called a database and a few widely used examples include Oracle, SQL
Server, and MySQL.
Databases are run from a server, which is essentially a remote computer. A
back-end developer will help manage this database and the site contents stored
on it. This ensures that front end elements on social media website can continue
to function properly as users browse uploaded content and other user profiles.
Note:
• The front end can be created using Visual Basic, HTML, programming languages
The user at the front end of a system does not need to know how data is stored
and how it is modified or retrieved.
• The Back ends can be built using different Relational Database
Management Systems such as Microsoft Access, SQL Server, Oracle etc.
• Front end developers build elements like:
Buttons
Layouts
Navigation
Images
Graphics
Animations
Content organization
• Back-end web developers work on tasks like:
Building code
Troubleshooting and debugging web applications
Database management
Framework utilization
Application activity 7.9
1. What is difference between Front end and back-end development
2. Discuss different types of software used in:
o Front end development
o Back-end development
3. Describe tasks done in Front end and Back-end development
End of unit assessment 7
1. Define the terms below:
a. Web site
b. Web application
c. Web server
2. Differentiate between internet and web.
3. A program, such as Mozilla Firefox that lets a user display HT
ML-developed web pages is referred to as …………….
4. Discuss three key factors that a web developer should consider
before developing a website
5. Explain four types of image formats that can be inserted into a web page
6. Write sample HTML statements to demonstrate how to insert the
following:
a. An image of a car
b. Page with four horizontal frames
c. Table of 5 rows and 8 columns
7. Explain statement: <form action =»login.php» method=»post»>
8. Differentiate between GET and POST methods used to send form
content to a web server.
9 Explain at least four types of controls that are used to create a form object.
10. Differentiate between Hypertext and hyperlink.
11. Giving examples, explain three restrictions that were imposed byXHTML that have been relaxed in HTML5.
UNIT 8 :ICT TOOLS IN ACCOUNTING
Introductory activity
Kamali’s grandfather worked in a bank in 1980. He narrates that at that time
when a customer came to the bank, a bank staff had to get his/her booklet,
locate his/her information sheet which was kept in a box with other clients’
information sheets and bring it to the teller. When a transaction was done
the information about that transaction was kept both in the booklet and the
customer information sheet. The teller had to count the money by hand and
give it to the customer. The bank’s staff had then to take back the customer
information sheet and put it again in its appropriate place.
Visit the nearest bank of your home or school, and request to branchmanager some information about:
a. How the bank process was done in the years 1980
b. What are the dangers presented in that banking process stated in question 1?
c. What are the common ICT tools used at banks in these days?
d. How the current banking system corrected the problems that
were in the old banking system.
8.1 Counting machines
Activity 8.1
Kamanzi is a company owner whose activities are carried out in East Africa
and China. At the end of the day the company’s headquarter have to count
the received money and deposit it to the company’s accounts.
1) If at the end of the day this company has hundreds of millions to
count, what are the tools that they will use to ease this task?
2) State the process of using the tool given in questions 1)
3) Give at least the parts of the tool you have given.
A counting machine or more precisely a currency counting machine is a machine
that counts money. They are in different types namely bank note only counters,
banknote and coin counters, coin sorters, coin counters. All these machines
have many advantages including among others saving time and resources,
fighting counterfeited notes, increased accuracy in accounting and facilitatingthe keeping book of accounts.
8.1.1.Banknotes only counters
These are devices which can count bank notes only. Most of the counters need
to be fed with sorted notes for counting to be properly done meaning that they
can count only same value bills at the same time. However more advanced
counters can identify different bill and provide a total currency value of mixedbanknotes, including those that are upside down.
NB: There are devices which can count both coins and banknotes. These are
called Banknotes and coins counters.
A. Parts of a banknote counter
Apart from the external frame, a banknote counter has different part which areseen from outside of which are not visible as they are encased inside.
B. Using a counter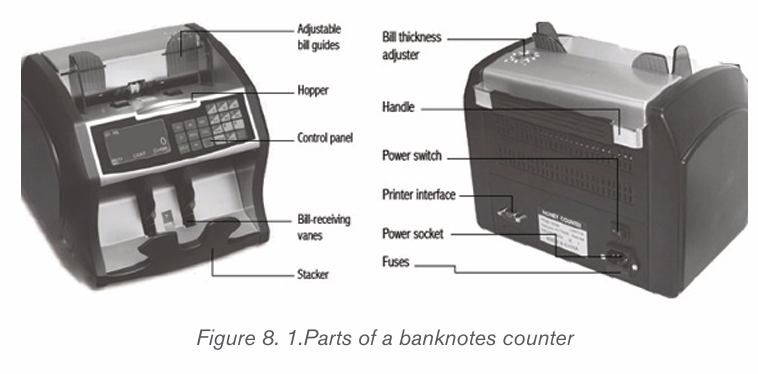
A billing machine is used in the following process :
• The billing machine has first to be plugged to the power source using
its powercable then switched on. If the billing machine has a battery, it
can be operated without being plugged to the power source.
• Select the function that the counter will perform
• Place the bank notes in the appropriate tray
• Press the start button for the counting operation to start
i). Some of a counter’s functions
A counter has functions which facilitate how it is utilized by a user. Some of the
basic functions are:
Currency Code: After the machine is turned on, the currency kind is displayed
on the screen. To change the current currency press “CURRENCY” key to
choose a new currency.
Counting Mode: There are different counting mode which are selected by
pressing the MODE button. One example of counting is batch in which the user
specifies the number of notes to count say 100 notes.
ii). Counter basic maintenance
A counter may have slight problems that don’t need deep competences in order
to sort them out. Those problems can be prevented in this way:
• Clean regularly the counter for optimal performance. This cleaning
includes that of the hopper and stacker which has to be done using a brush
• Clean the banknote pathway using a soft brush or a dry soft lint free cloth
• Occurrence of error during banknotes counting can be solved by doing
one of these depending on the kind of error: Removing the banknote,cleaning the counter’s sensors.
8.1.2.Coin sorters and coin counters
Coin sorters are devices used to arrange coins into separate groups according
to their denominations. These devices are commonly specific for coins of specific
countries as the size of coins may vary depending on countries. Some sorters
have screens which show the number of the coins that passed through it.
As its name suggest, a coin counter on the other hand is used to count the value
of coins. However some of these devices both sort and count coins at the same
time or count only presorted coins that are all the same size. Most counters use
bowl with flat spinning disks at the bottom of the bowl to distribute the coins
around the bowl perimeter. At the bottom of that bowl there is an opening which
allows the passing of one coin at a time. These coins then pass through a light
beam counter or are pushed through a spring loaded cam that accepts only onecoin at a time.
Application activity 8.1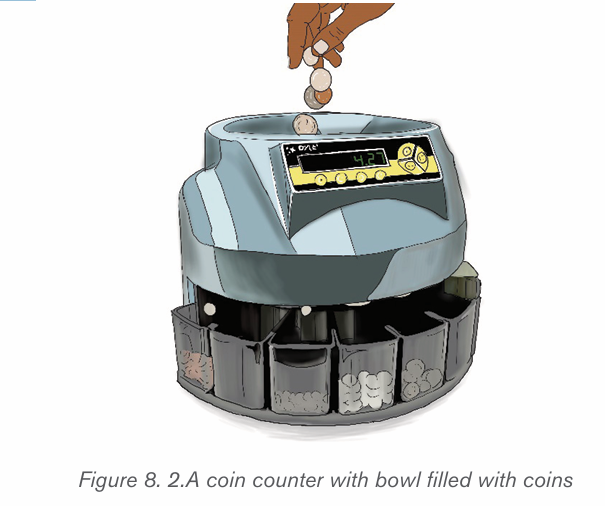
1) What is a banknotes counter?
2) What are the different parts of a banknotes counter?
3) By doing a research identify the internal parts of a banknote only counter
4) By doing a research on the internet find at least 5 different banknotes
counters and their specifications. The specifications should at leastinclude the counting speed, hopper capacity, stacker capacity, weight.
8.2.3 Billing machines
Activity 8.2
Isimbi, a student in was doing a research about billing machines used in
Rwanda. She visited one supermarket to ask questions to the owner, clients
and the supermarket staff. Suggest the answers she will get about the
following questions:
1) Which machines are used to make bills in a supermarket?
2) How does the supermarket staff proceed in order to make a bill for
a customer?
3) Which type of information is found on a bill?
4) What are the advantages of the billing system in a supermarket in
regard to:
a) Stock management?b) Paying taxes?
These are machines that are used in entering in a system of customer informationand purchased goods so as to come up with invoices or bills.
For these machines to print bills they use a thermal printing process by which
images are produced by selectively heating coated thermochromic paper when
it passes over the thermal print head. The coating becomes black in the areas
where it is heated, producing an image. Two-color direct thermal printers can
print both black and an additional color (often red) by applying heat at two
different temperatures.
Bill printers print by direct contact between the thermal head which generates
heat and thermal paper which is thermally coated to be sensitive to heat. The
paper rolls available are sensitive to the heat and thus when the heat is produced
it can easily initiate the process of printing. It can print more than just a single
color by setting the printer to different temperatures.
The world is becoming more digital and this require that stores acquire billing
machines as every business is required to issue receipts generated using billing
machines. Billing machines reduce the chances of error, once the required
information is entered into the system, it automatically updates each new billwithout any additional effort.
8.2.1.Main parts of a billing machine
Billing machine systems, like most electronic devices, consist of different parts
which play different roles grouped into three categories namely inputting data,
processing and printing bills. The first part is the keyboard which is used
to feed information like goods names in the billing machine. The second part
can be considered to be the processor and all parts working with it like memory
and motherboard. The third part is the printer which plays the role of helping
get hard copy bills. Also in the same third category is a screen which displays
information that a billing machine user can understand. Note that some billing
machines may have additional parts which help in payments like a weighingscale.
8.2..2.Operating a billing machine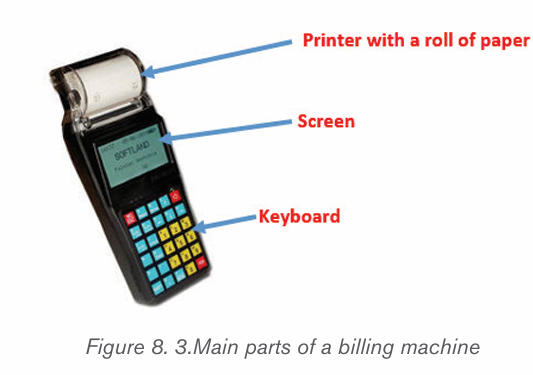
Producing a bill by a billing machine requires the presence the information to
appear on the bill. That information can be fed to the billing machine’s printer
from different sources namely the database on which the billing machine is
connected through internet or a local network, the billing machine’s permanent
memory or temporary memory. The temporay memory of this machine keeps
information which is immediately fed to it by using its keyboard or any otherinput device
Before using a billing machine make sure the following is met :
• It is properly connected to a power source or that its battery has enough
power,
• It is properly connected to a local network or internet by the use of a
cable or wireless network. This is necessary when the machine gets or
submits data to a database stored at another location
• All the peripherals to a billing machine are properly connected
• Make sure that as a user, you have the right access credential if the
machine is password protected
When a billing machine is ready follow the following steps to use it:
• Log in to the machine. Some may need a username and password
while some need a swiping card accompanied by a password.
• Enter the billing information by using the keyboard. This information
is about the client details, purchased goods details and amount to be
paid. Most of the time the price of each item purchase is got from
the machine’s database and the total price to pay is automatically
calculated.
• Print the bill by pressing the key for printing
Note that:
Some billing machines may not require login depending on how their
setting were configured. There exist typically three types of user on a
billing machine namely Clerk who can only generate invoice, the Admi
nistrator who can generate Invoice and Reports, add or modify items and
their price, change print settings and the Supervisor who has access
to all that the administrator can do and more to that have access to
System settings, Erase Memory/Bills, Create different users and assign
password.
Billing machines allow users to get different reports. Depending on the
available functionalities, these machines can provide daily, weekly oryearly reports.
8.2.3.Billing machines in Rwanda
Rwanda through the Rwanda Revenue Authority (RRA) adopted the use of
billing machines from 2013. These machines which are known as Electronic
Billing Machines (EBM) are devices which receive information from the user like
bought items and generate a bill which is then printed. These devices come with
software installed by the manufacturer or the vendor and the user can not easily
remove or add a new software.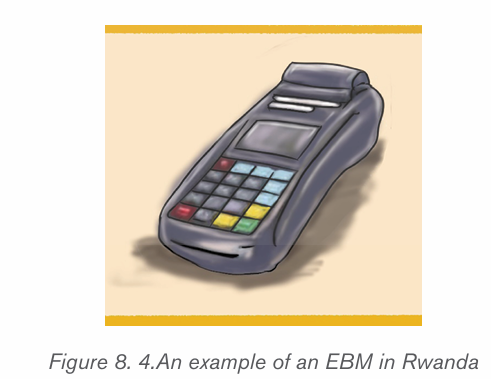
In 2017 Rwanda Revenue Authority adopted a new version of EBM which
is known as EBM version 2 (EBM ver2.0) which is a software installed on
a computer allowing then to have access to the central database. With this
software installed, after logging in the user has access to different functionalities
including among others item management, customer management, sales
management, purchase management. This EBM also allows the printing of aninvoice to be given to the customer.
8.2.4.Types of billing machines
There are machines which are dedicated to be billing machines. With these ma
chines the software which make them operate is installed by the manufacturer or the
vendor and these devices cannot play another role other than the one they were made
for. On another hand, billing machine functionalities are implemented in a software
which can then be installed on electronic devices like computers, ipad, smart phones
and therefore acting as billing machines.The different types of dedicated billing machines are outlined below :
A. Portable machines
Billing machines that can be moved from place to place are referred to as
portable machines. The handheld machines or the bus ticketing machines areexamples of such machines.
Among portable machines are card swipe machines which are devices that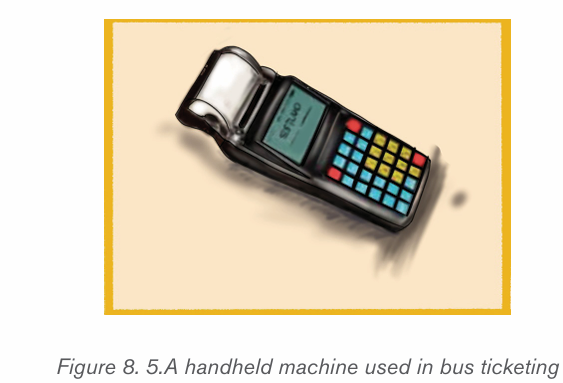
read the magnetic stripe on a card and takes the information from it. The most
common card swipe machine is a credit card reader that is used with a cash
register. These machines come with a keypad for the customer to enter the PINof the card, a display bar and a swipe slot for swiping the card.
B. Automatic machines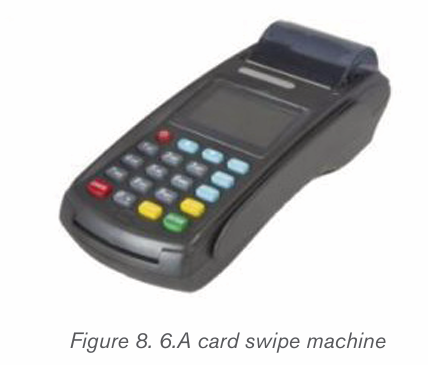
These are machines come with software and algorithms inbuilt in it to add up the
taxes and deduct the rebates automatically. No additional manual instructionsare required for such type of machines.
C. POS machines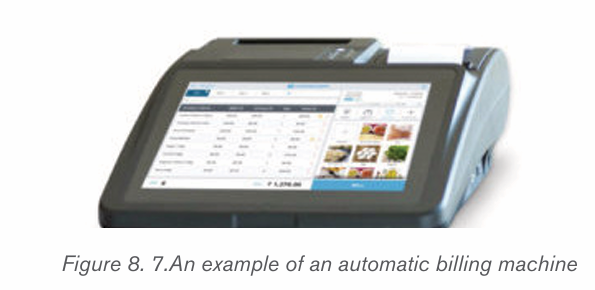
The POS or the Point of Sale is a billing technology used in supermarkets to
keep track on the sales of goods. This system uses bar-code technology to
perform tasks like review sales or prepare the next fresh lot of products that
need to be replaced with the sold-out ones.
Normally a POS system is referred to as a cash register at a store. While this is
still true today’s modern POS systems accepts payments even when customers
are away from the POs system. What is needed in this case is a POS app and
an internet-enabled device, like a tablet or phone.
Hardware parts of a POS system
POS system uses POS software. However in the case of an online store the
POS system does not need to have the hardware. In this case of an online store
all of the sales happen on a website, so the business owner does not need POShardware to help accept payments.
Register: this helps calculate and process a client’s transaction.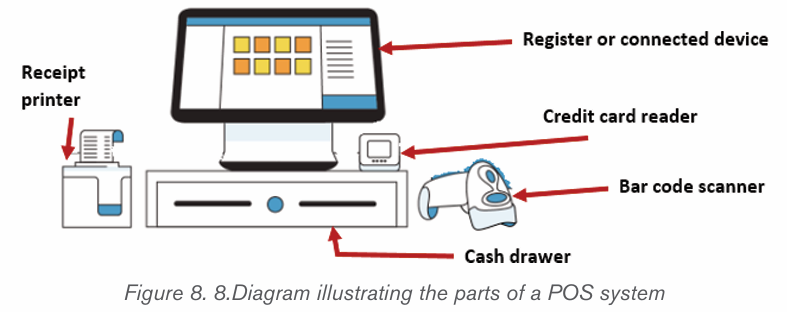
Connected device, like an iPad or other tablet: These are devices
equipped with a monitor allowing the user to view a list of items and
interact with the system Credit card reader: A card reader lets a customer pay by credit card
while in the store.
Cash drawer: This is a place where cash can be kept in case the
store accepts payments in cash. POS software that’s connected to a
cash drawer can minimize fraud by tracking exactly when the drawer is
opened.
Receipt printer: A paper receipt shows customers exactly when and
what they purchased and how much they paid.
Bar code scanner: A bar code scanner reads an item’s product de
tails so you can ring it up. It can also be a quick way to double-checkthe price, stock level, and other details.
Application activity 8.2
1) What is the technology used by billing machines in printing the bills?
2) What are the 3 main parts of a billing machine?3) What is EBM version 2
8.3 Note detector
Activity 8.3
1) Suppose you are a teller at a new bank which features will you check
in a note in order to discover counterfeited notes
2) Which device will your bank buy in order to detect fake notes easily?
3) What are the advantages that using the device stated in question 2 has?
A note detector is a device which is designed to sort identify a fake note which
does not have all the attributes of a nation’s notes. Fake notes can be identified
by using hands and eye, a counterfeit detector pen, or a machine known as anote detector.
i) The Counterfeit Detector Pen
Counterfeiters don’t use expensive special inks to try to closely duplicate paper
currency. They instead try to create a bill that looks like the authentic one by using
their available means which include wood-based paper. However, their bills would
not raise any initial suspicion when used in an everyday purchase.
One of the simplest tools used for counterfeit detection is a Counterfeit
Detector Pen. This pen contains an iodine solution that reacts with the starch
in wood-based paper to create a black, marker-like stain. When the solution
found in this pen is applied to the fiber-based paper used in authentic bills there
is no change in color and no stain appears. This tool is useful for identifying
amateur counterfeit currency. However, when dealing with more sophisticatedcounterfeit bills, utilizing a more complex detector is be necessary.
ii) Fake notes detection by a counter
Some banknote counters can also detect counterfeit notes by using one of the
following methods:
• Magnetic counterfeit bill detection: This is a method by which the
specialized magnetic ink which is found in bills is read by currency
counters with magnetic detection capabilities to identify counterfeited
bills from genuine ones.
Magnetic inks are ones with pigments containing magnetic material typically
iron oxide similar to what is used in the coatings of audio and video tape. These
inks are employed by most countries in the printing of paper currencies.
There are different methods and devices used in detecting the magnetic
properties in currency such as hand-held units and single-bill readers that
require the user to rub or slide the bill across a sensor. This device then emits
an audible signal to indicate the presence of the magnetic properties in the
bill. These devices are easy to use and are effective but they are impractical
for banks and big businesses with big amounts of cash to verify. There are
also more effective and quick modern money counters equipped with magnetic
counterfeit technology which can scan hundred or even thousands of bills per
minute.
• UV counterfeit detection: This is a method in which detection
devices use ultra-violet light to detect fake notes. With this method the
counterfeit detector works by detecting the UV fluorescent phosphors
used on authentic bills. This phosphor produces a reaction when
placed under the UV light but remains hidden when viewed under
normal lighting conditions. The UV ink changes its appearance and can
then be easily seen by the human eye under UV light.
Apart from banknotes detectors which have fake notes detection functionalities,
there are note detectors which have the sole functionality of detecting fake
money by using the ultraviolet light or the magnetic detection method. To use
these devices the user places suspicious notes in the appropriate place and thedevice detects its authenticity
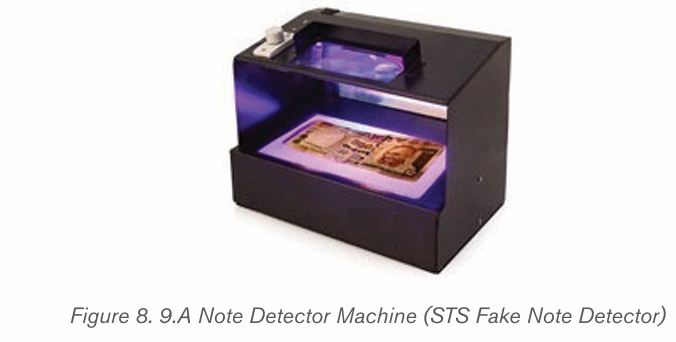
Application activity 8.3
1) Explain the methods used by a note detector to identify fake notes2) By doing a research on the internet, identify the parts of a note detector.
8.4 Automatic Teller Machine
Activity 8.4
You have at least once visited banks in Rwanda.
1) Explain how the process of withdrawing and depositing money at a
bank is done
2) Give the name of a machine that can do the task of a human teller?
3) Explain how withdrawing and depositing money using the machinestated in 2) is done.
An ATM known in full letters as an Automated Teller Machine, is a specialized
computer device that is used by bank customers to perform transactions on their
bank accounts. With these devices customers can check account balances,
withdraw or deposit money, transfer funds from one account to another, print astatement of account activities.
ATMs can be found in financial institutions like banks. However there are also
ATMs that can be displaced and found at other places like airports, shopping
malls where there may be many people needing cash. ATMs started being usedas a response to labor cost and request to get cash even after working hours.
8.4.1.Parts of an ATM
Like other computers and most electronic devices, an Automatic Teller Machinehas two parts namely hardware and software.
A. Hardware
The hardware parts of an ATM work together in order to make a transaction
possible. An ATM has parts that are visible by the client that can be considered
as an interface and other parts which are visible by the bank administrators.
Although each ATM offers various features other than basic services, all the
devices contain the same components. The parts of ATM are detailed below :
Card Reader
A card reader is a device that can decode the information contained in a credit
or debit card’s magnetic strip or microchip. In finance, this term refers to the
technologies used to detect the account number, cardholder information, and
authorization code contained on a credit card. When a customer inserts a card
in the machine, a card reader reads the account details of the clients then verifythe provided information and process the transaction.
Keypad
A keypad for electronic devices is an input unit which enters data in that device.
Keypads have keys which are mostly numeric and letter keys. When the bank
card holder has put it in the ATP slot, he/she is prompted to enter a password,
choose among different options, etc and this is done using the keys found onthe keypad
Cash Dispenser
A cash dispenser is the part that contains cash. Cash dispensers are connected
with a safe that contains cash. Through cash dispensers, customers receivebanknotes in return to the transaction they made.
Printer
An ATM printer has the role of printing a receipt of the performed transaction.
The printed receipts include all the details of the transaction for cash withdrawal.
It further shows the total balance that a cardholder has in their bank account.
Screen
The display screen in ATM shows the cardholder all the details. It prompts the
customer through each step of the transaction process. Nowadays advanced
ATM screens may be touchscreens whereby instead of using the physical keythere is a virtual keypad laying under the screen.
SpeakerThe speaker provides feedback in form of audio when a particular key is pressed.
Vaults: This is a house to which store the parts of the machinery requiring restricted
access.
Note also that, like other computers, ATMs have most hardware parts found
inside a computer like processors and motherboards to support the whole
circuitry. Moreover they have sensors and indicators and cameras. One of the
functions of a sensor is to measure if the thickness of the bill is normal in order to
avoid that two bills may pass at the same time which would result in a customerreceiving more money than requested.
A. Software
Like any other electronic device that performs complex tasks, an ATM has an
operating system. Today, the vast majority of ATMs worldwide use Microsoft
Windows among which a big number runs on Windows XP (95% in 2014).
There are also a small number of ATMs which are still running older versions
of Windows such as Windows NT, Windows CE or Windows 2000. Some
others use newer operating systems such as Windows 8.1, Windows 10 andWindows 11.
Windows is not the only operating system for ATMs because in these days
Linux is also finding some ground like in Brazil where the Banrisul bank’s ATMsrun on Linux.
8.4.2.Withdrawing and depositing from an ATM
The process of withdrawing cash from an ATM machine has to go through a
number of steps starting by insertion of the bank card and a withdrawal of thatsame card. Those steps are outlined below:
Step 1: Insert an ATM Card in the card slot
Step 2: Select the language from the language options appearing on the display
screen
Step 3: Enter ATM Pin using the keypad. For most ATMs PIN are in 4 digits.
Do not ever share your ATM Pin with anyone even with bank staff. Ensure that
nobody is watching you, while you enter the Pin. Make sure you enter a right pin
as entering a wrong one may lead to the blockage of the ATM card.
Step 4: Select the type of transaction which can be withdrawal, deposit or
transfer.
Step 5: Select your type of account: As an individual banker, you should be
choosing a savings account, as current accounts are a special type of accounts
used by businesses. Some ATMs offer you a choice to add a line of credit to
your account. This can help a banker when they need excessive money in an
emergency.
Step 6: Enter the withdrawal amount. The withdrawal amount should not be
more than the balance in your account.
Step 7: Collect the cash from the ATM cash slot
Step 8: Take the receipt which is produced by the ATM printer. Making the
printer produce a receipt is done by prompting the ATM to print it. If you choosenot to have a receipt, it will not be produced.
A. ATM malfunction errors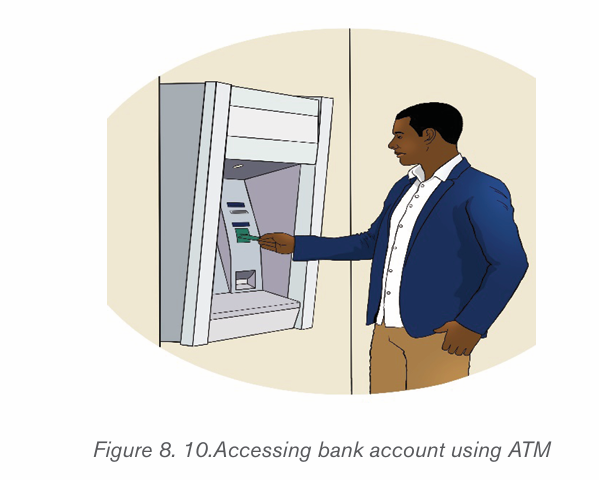
The hardware components specifically the ones which move may wear out or
get old therefore resulting in a faulty equipment
• Faulty dispenser
When the dispenser has problems, customers insert their ATM cards in the slot,
enter their password or PIN, select the cash withdraw option and fill the cash
amount but when it arrives at the steps of counting and dispensing the cash
everything halts yet the customer’s account has already been to the full amount.
Another scenario is that ATM may fail to provide the full requested amount.
When such errors happen, the customer will have to apply for payment and the
bank manager will verify that application.
• Worn out card reader
Bank cards have a dark magnetic stripe on the back which contains specific
details about the card and its owner. When the bank card is inserted in an ATM,
the reader verifies the information on the card before it authorizes the transaction.
As a card is used again and again, the ATM card reader wears it out therefore
making the reading of information on the card impossible. If this happen, obviously
the transaction the customer wanted to carry out will not be done.
• Broken Keypad
The keypad which is used as an interface between a custom and the ATM may
be broken or one key may stick or may be unresponsive. If among the keys that
the customer needs have such problems, a transaction will not be possible.
• Receipt Malfunctions
The ATM printer may not give a receipt due to different reasons such as when
the machine has run out of paper, the printer has run out of paper, there is a
paper jam or any other problem with the ATM printing system. Since the receipt
contains vital information about the ATM transaction, it’s imperative that any
issues with printing receipts is handled quickly.
• Software glitches
ATM have different software whose technology never ceased to advance. Many
ATMs now have touch screen and other technology that relies on computer
software to function. Like other machines that run on computer software, ATMs
can have software glitches. When such problem happens, a transaction in not
possible.
Application activity 8.4
1) By doing a research on the internet, identify the internal parts of an
Automatic Teller Machine
2) Can an ATM be hacked? If yes explain the likely consequences of this hacking.
Skills Lab 7
Use different ICT tools in Accounting you have learnt to perform the
following activities:
a) Counting money
b) Detecting fake money
c) Withdrawing using ATM cards
End of unit assessment 8
1) What are the benefits of using ICT tools in Accounting
2) Describe the ICT tools you have seen in this unit
3) Using the internet do a research on the software tools used inAccounting
REFERENCES
1. MINEDUC, (2013), Education Sector Strategic Plan, Kigali.
2. MINEDUC, (2014), ICT in Education Policy, Kigali: MINEDUC.
3. MYICT, (2011), National ICT strategy and plan NICI III-2015, Kigali.
4. Herman Oduor, 2014, Senior Secondary Certificate Computer Science
for Rwanda student’s book 4, East African Publisher, Kigali
5. National Curriculum Development Centre(NCDC), (2010), computer
science curriculum for computer science economics and mathematics
option & mathematics physics and computer science option, Kigali,
Rwanda
6. www.sumup.co.uk/invoices/dictionary/quotation/ 27/03/2022
7. www.umucyo.gov.rw/ 27/03/2022
8. https://www.reviews.in/best-billing-machine.html
9. http://mybillmachine.com/ visited on 27/03/2022
10. https://carnation-inc.com/ visited on 28/03/2022
11. https://tax-handbook.rra.gov.rw/handbook/explanation-of-ebms/ visited
on 30/03/2022
12. https://squareup.com/us/en/townsquare/what-pos-system visited on
31/03/2022
13. https://en.wikipedia.org/ visited on 01/04/2022
14. https://www.tutorialspoint.com
15. https://www.tutorialandexample.com16. https://www.tutorialandexample.com